A little bullish. A little bearish....
The S&P index is up about 3 points at 2724 currently. The high reached 2732.08. The low extended to 2711.26.

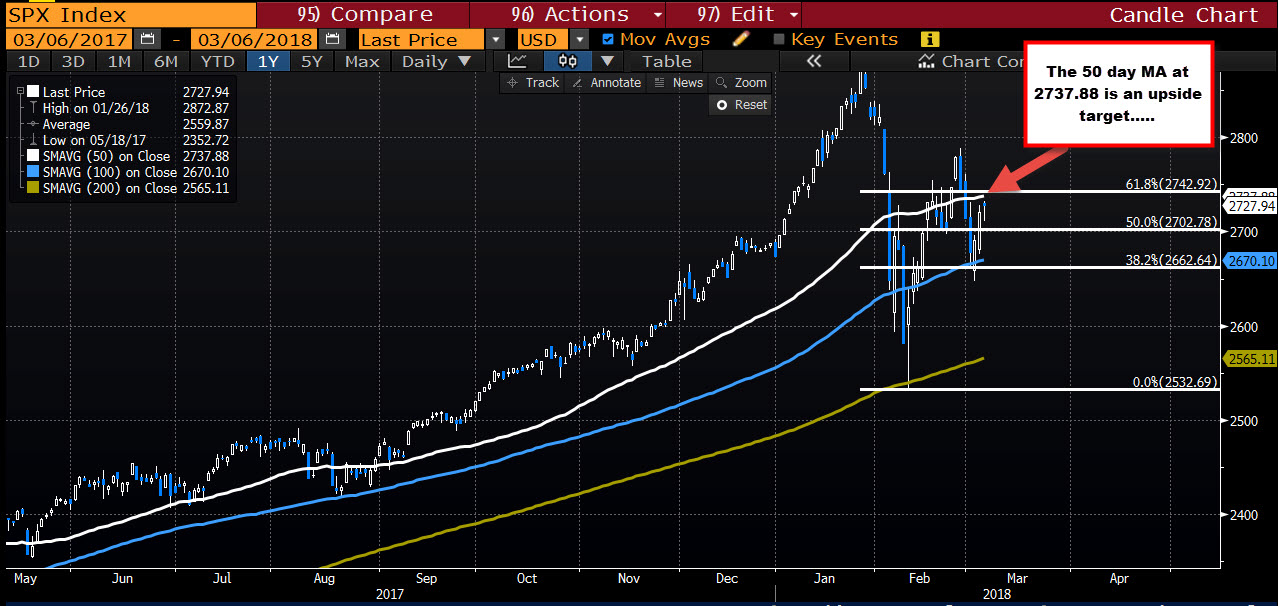
Technically, looking at the daily chart, the price on Friday, dipped below the 200 day MA, but that break failed. Bullish.
The not so bullish is that the price has stalled ahead of the 50 day MA at 2737.88 today. Get a push above that MA (and stay above) and the buyers can feel more comfortable. Of course, if you don't trust the market, selling against the 50 day is also an option and may be what is putting a lid on the index today.
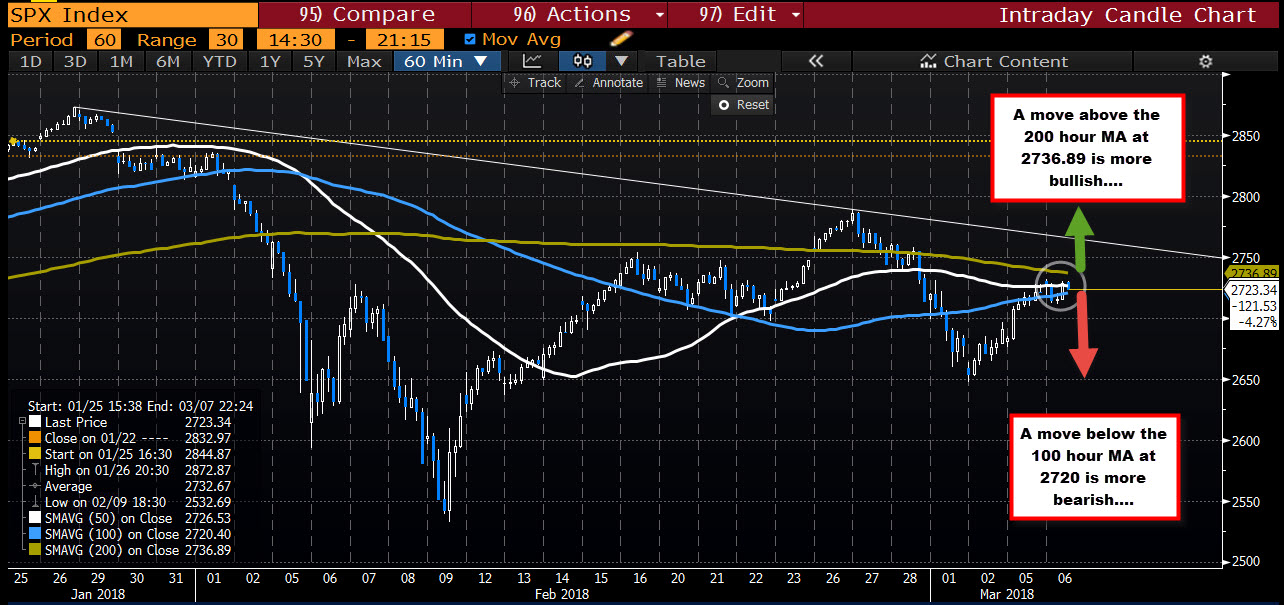
Drilling to the hourly chart, the up and down market over the last 9 or so hours of trading (going back to yesterday) has seen the price action trade above and below the 50 and 100 hour MAs at 2726 and 2720 respectively (white and blue line in the chart below), but below the 200 hour MA at 2736.89. The high today reached 2732.08.
If the price is going higher, get and stay above the 200 hour MA at 2736.89 and then the 50 day MA at 2737.88.
If the price is going lower, get and stay below the 100 hour MA at 2720.40.
The market is looking for the push. Which way will it go?


