200 day MA, 50% retracement, swing levels stall the rally
The GBPJPY moved higher in trading today on the back of risk on sentiment, and in the process tested some broken levels from last week.
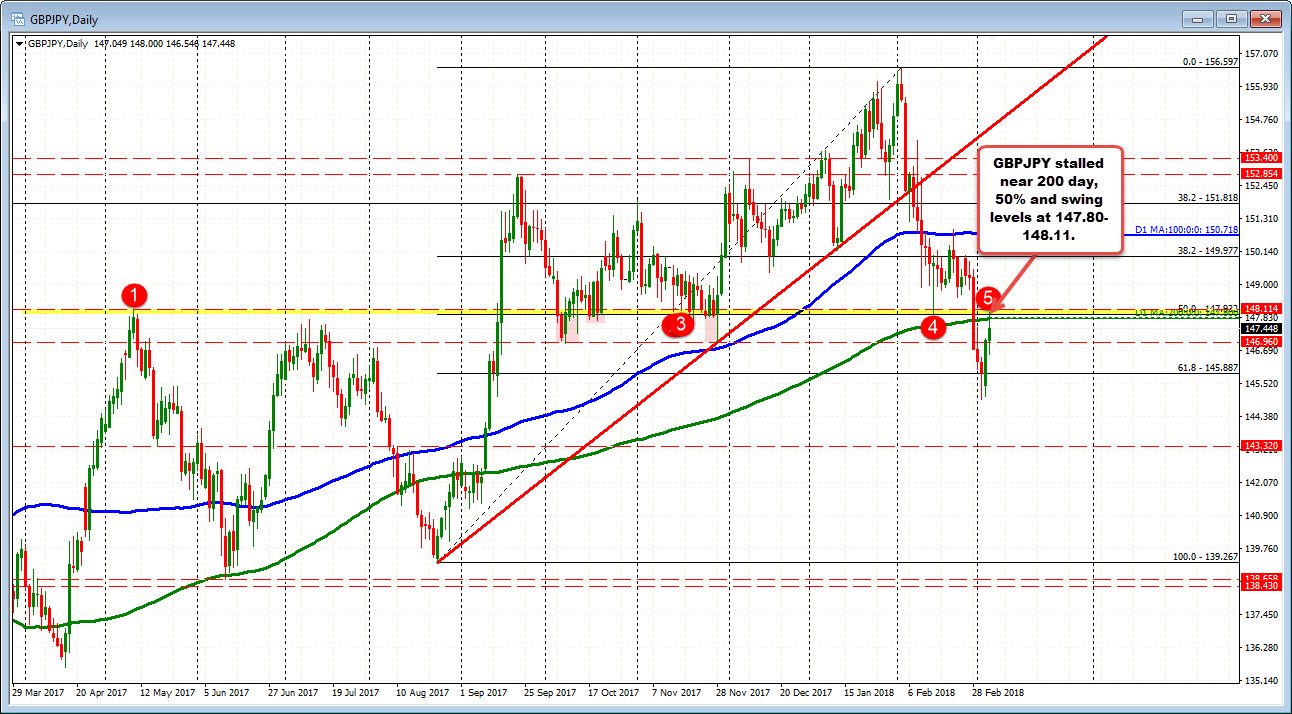
- The 200 day MA comes in at 147.80.
- The 50% midpoint of the move up from the August 2017 low comes in at 147.93
- Swing level comes in at 148.11.
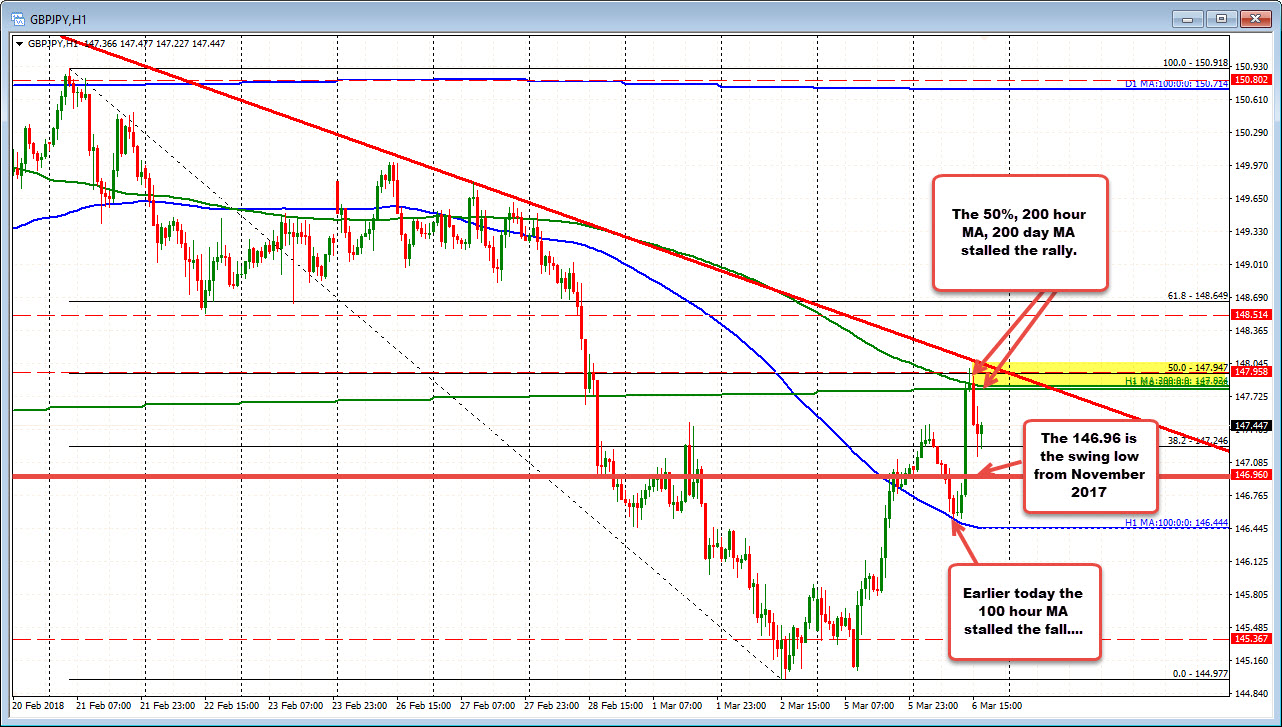
The high price stalled at the nice round level of 148.00 - in the middle of that range. We trade lower at around the 147.45 level currently.
Drilling to the hourly chart below, the pair trades in between the 100 hour MA below (see blue line at 146.44 below), and all that stuff above (you can add a trend line too off the hourly chart - see yellow area).
Honestly, the price can go either way from here, but given the run higher, keep an eye on the 146.96 level as an interim support level.
That level corresponds with the November 2017 swing low (see daily chart above). If you like the upside (stock rise, risk off flows, bullish moves), that is an interim risk level for buyers to lean against. Stay above more bullish. Then the market can work on the number of levels above that stalled the first run higher today.