4th day in a row with the price trading above and below the MA line
The price of bitcoin has traded to a new session low of $8872 on the Coinbase exchange, and in the process has moved back below the 200 day MA at $9045. The digital currency is trading at $8919, down-$698 on the day.
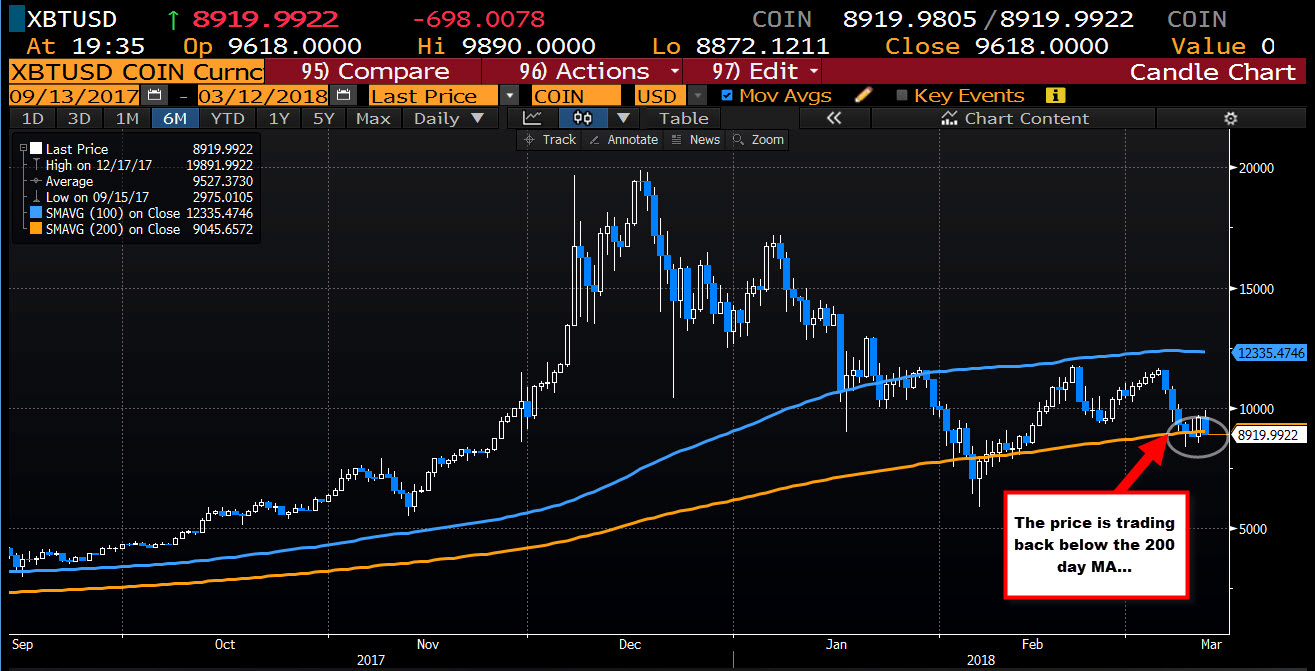
The last four trading days has seen the price trade above and below that MA level. So the break is not new.
However, at some point, the traders will start to trend the price away.
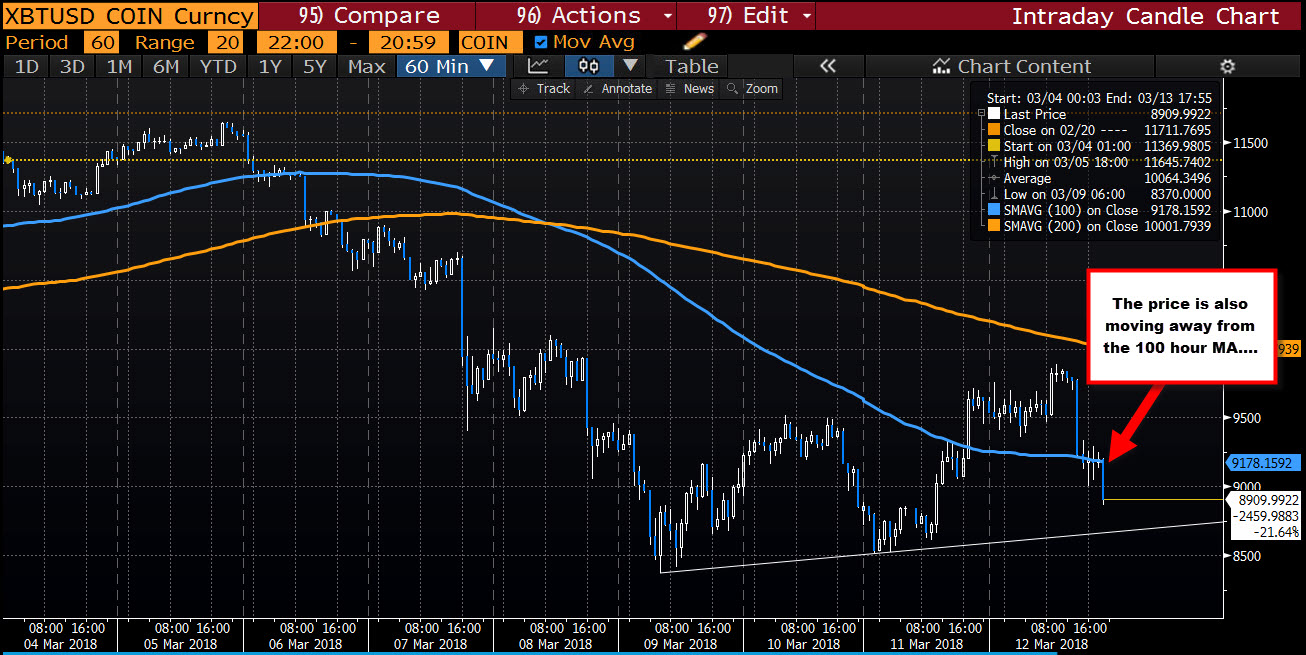
Looking at the hourly chart below gives the bears an edge.
Like the 200 day MA, the price on the hourly chart has been trading above and below a MA. On the hourly chart below, it is the 100 hour MA that has seen the price waffling above and below over the last 4 hourly bars.
The current bar is looking to break away. That dynamic - along with the dip below the 200 day MA - should have longs/buyers a bit more fearful, and that should lead to more liquidation/lower prices.
The sellers are making a play and the technical picture is getting more and more bearish in the process.