
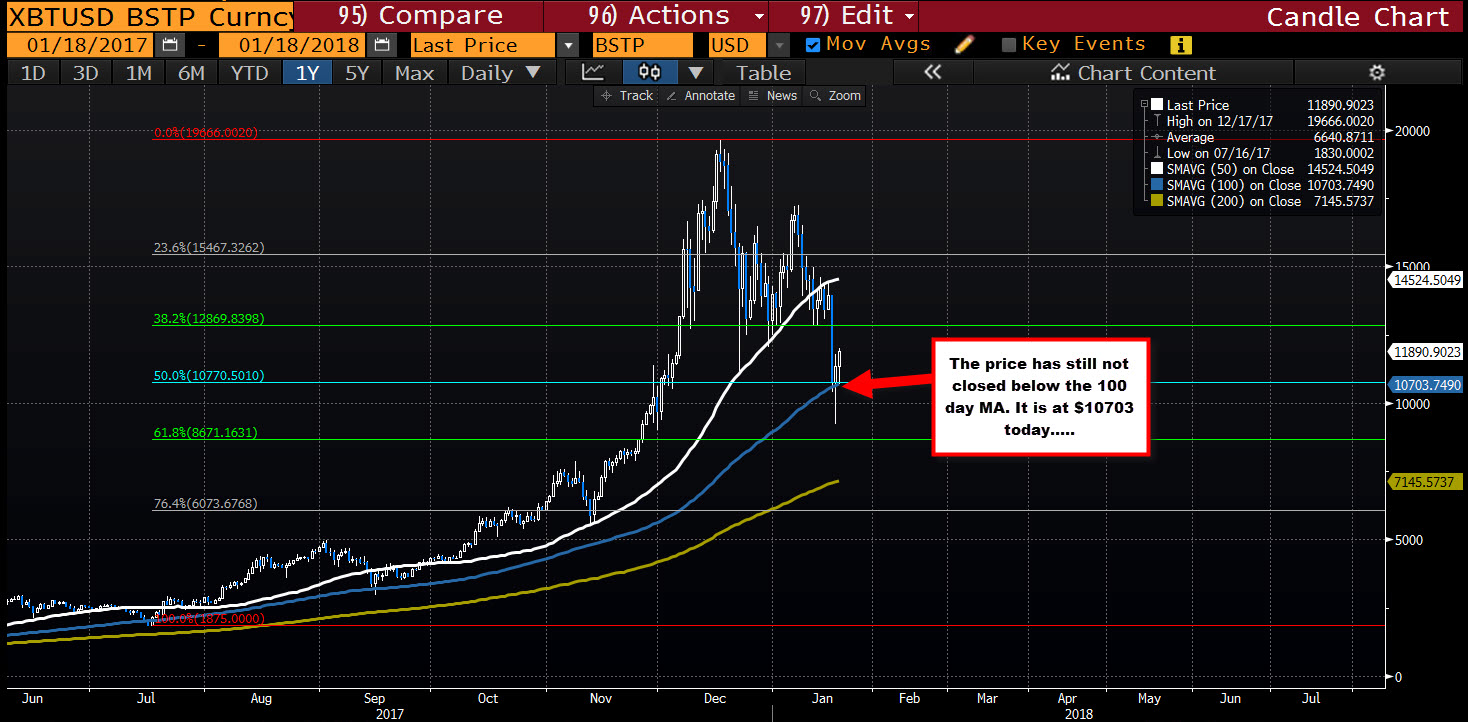
The going might start getting tough
After the price action yesterday that saw the price of bitcoin:
- Tumble down to $9,222 on the Bitstamp exchange,
- Move below the 100 day MA (currently at $10703 today), and
- Then rebound sharply into the close (the price still has not closed below the 100 day MA)
The price action today is up and down and up again. We currently trade near the high for the day and in the process are up testing some topside resistance targets (see hourly chart below).
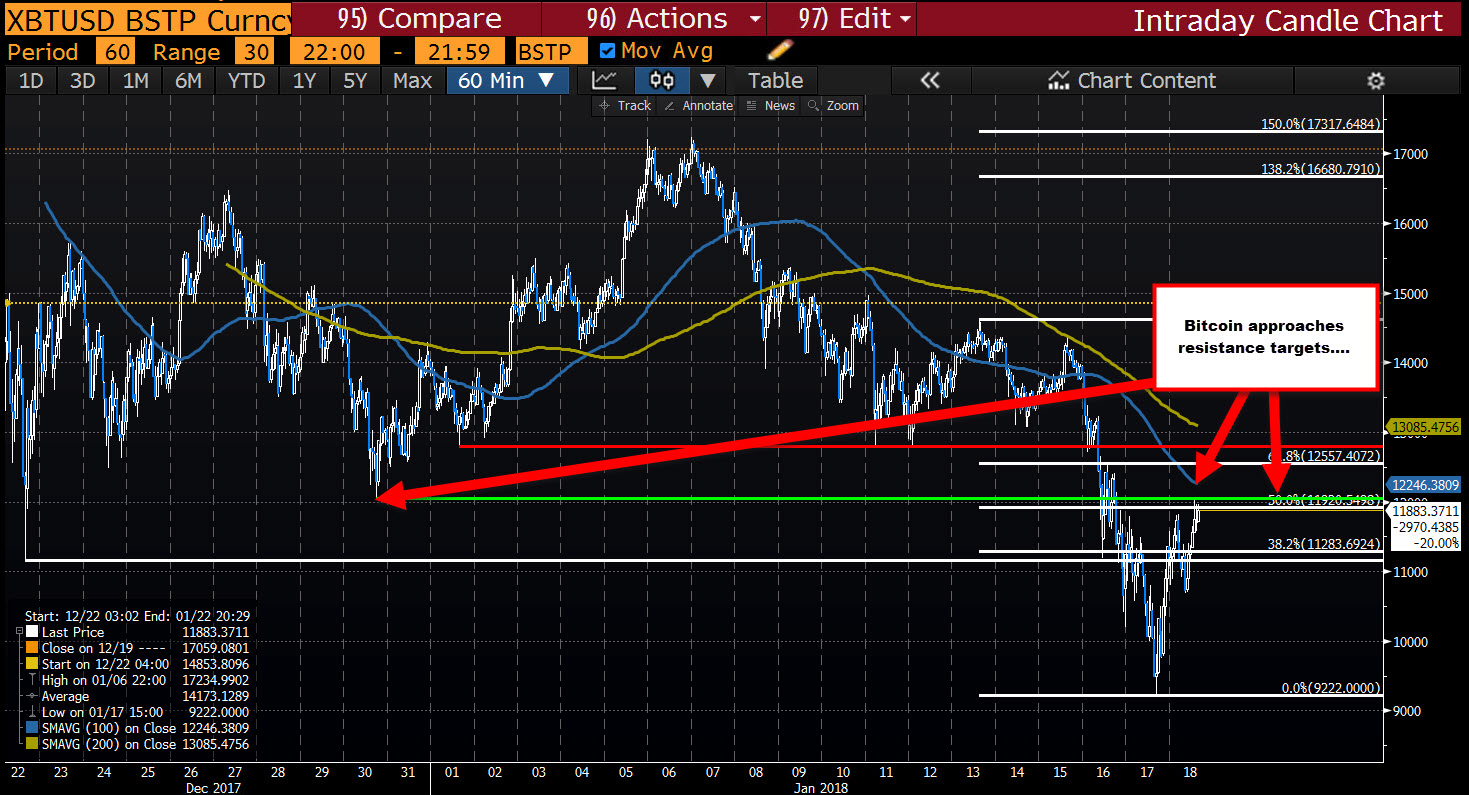
The first target comes in at the 50% of the move down from the January 13th high. That high was the start of the last swing move lower. The level comes in at $11,920. The price has moved above that level today but not by much.
The stall on the break above the 50% retracement can be attributed to the swing low going back to December 30. That level comes in at $12,050. The high for the day has reached just short of that at $12,028. A break above is needed to stretch the pair higher.
If that swing low can be broken, there will be other upside resistance at the falling 100 hour MA (blue line in the chart above) at $12,246.54. That MA tends to be a barometer for the bulls and bears. Move above, and you see follow through buying. Move below and you see follow through selling (see blue line). I expect that the 100 hour MA will be a tough nut to crack on the first test. Be aware....
If the price does stall and start to head back down, that 100 day MA at $10,703 remains a key technical barometer for the longer term bias for bitcoin. A close below would be more bearish technically.

