
This breakout is beginning to look like a dud
The FOMC Minutes and hawkish comments from Dudley have all the fundamental makings of a game changer but nothing is confirmed until the charts say so.
At the moment, five spots that looked like breakouts or breakdowns now looks like busts.
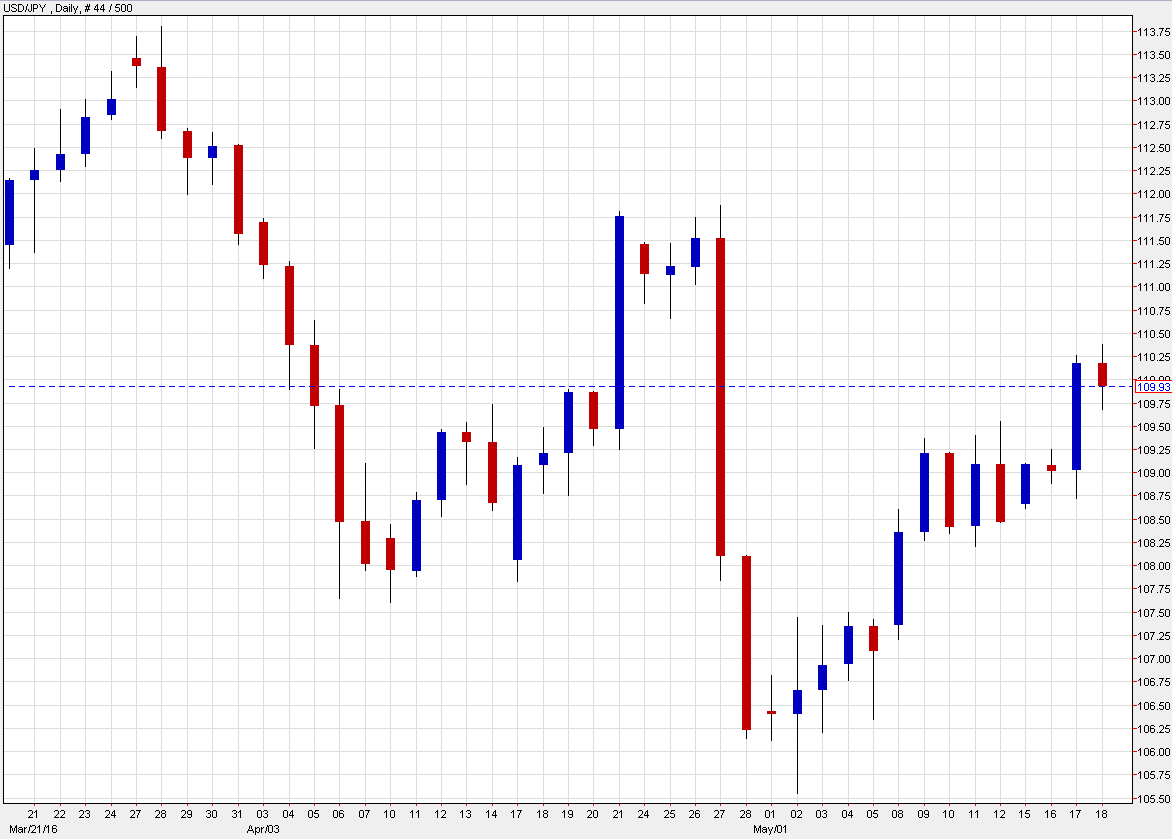
1) USD/JPY
It broke out of a wedge yesterday and still looks like it's heading towards a complete retracement of the post-BOJ drop but the lack of follow through today is concerning.
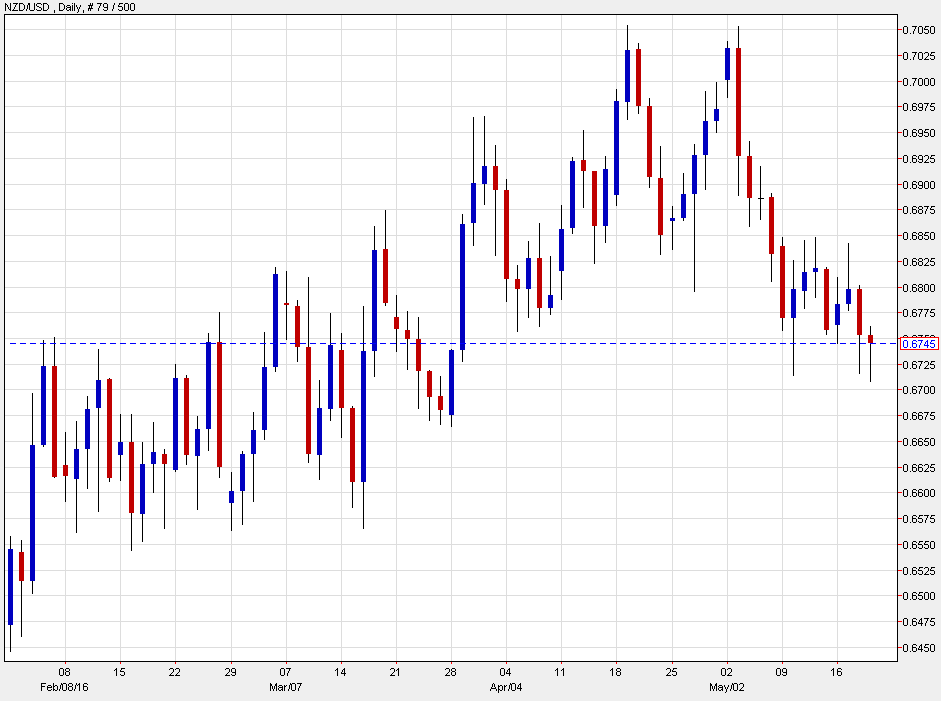
2) NZD/USD
The kiwi touched the lowest point since late March and that should have tripped stops and inspired more selling. Instead, it's bounced back to nearly unchanged on the day.
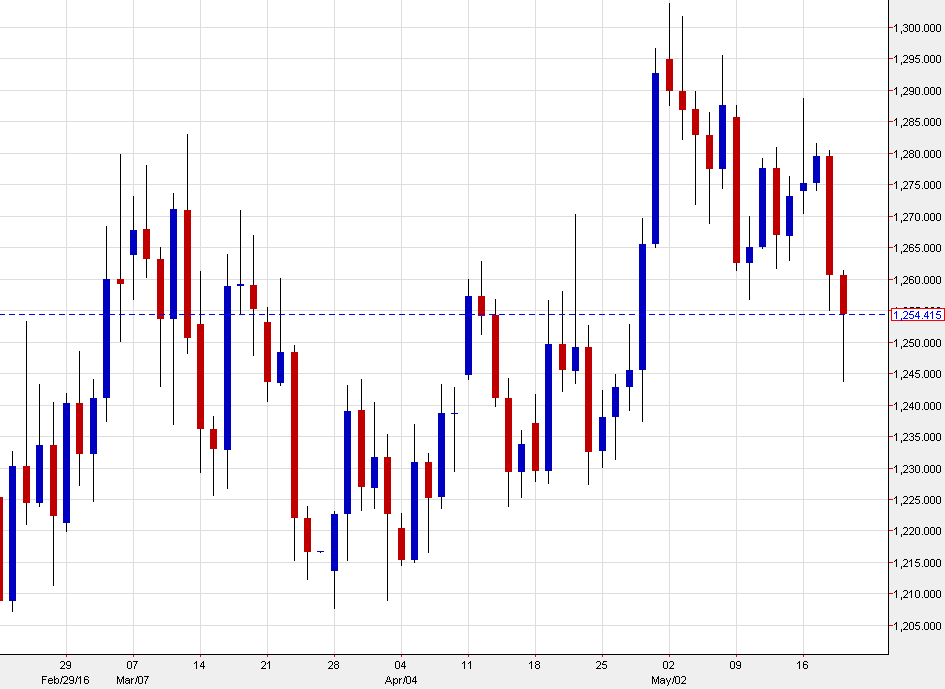
3) Gold
Gold broke the May low and there is now a series of lower highs on the chart. The gold trade has gotten a lot of hype since the start of the year and this was a chance to thin the herd but the rebound points to more underlying demand -- at least for now.
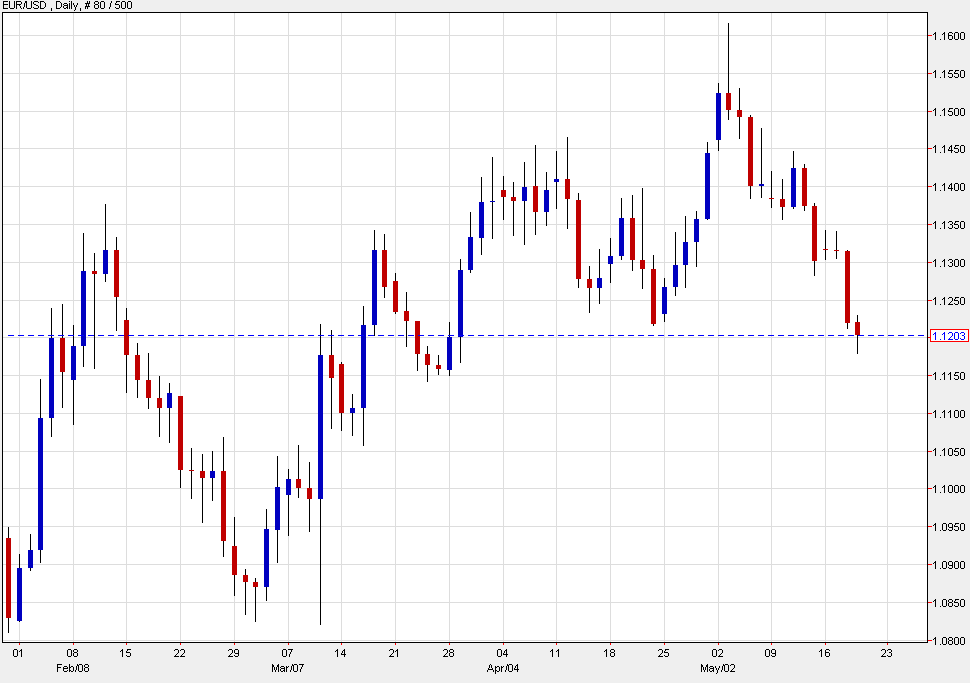
4) EUR/USD
Yes, the euro broke the late-April low and the chart looks bearish, at least down to 1.1150 but this is hardly the kind of enthusiasm you'd expect from the dollar bulls. Most of today's declines have been erased.
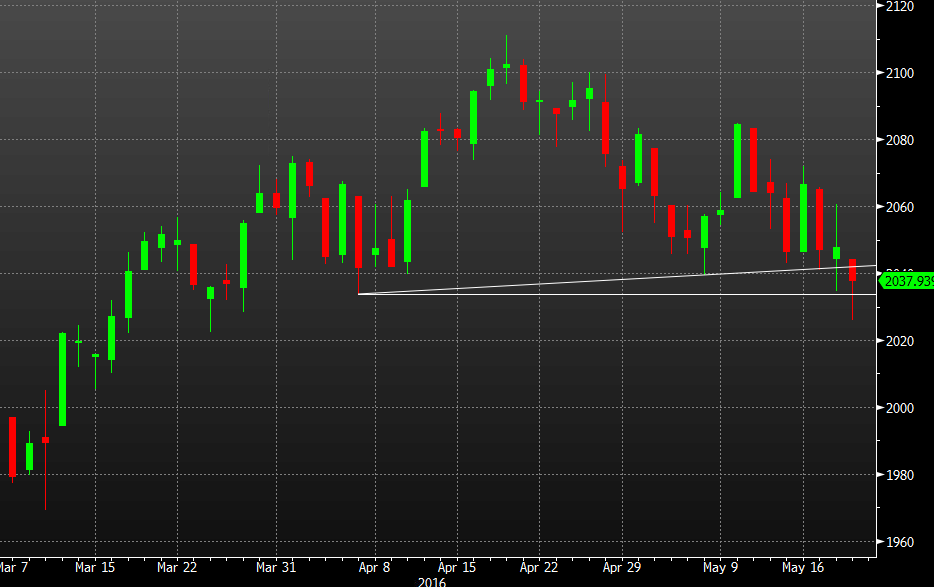
5) S&P 500
It's not a dollar chart but it correlates. If a June hike is coming, stock market selling is a near-inevitability. A close below these levels would have pointed to 1975. Instead, we're stuck in the muddy middle.
What's next
I think it's a pause. Oftentimes, you get something I call the 'buyers remorse' after a breakdown. You expect to see some follow-through but a bounce comes first.
In practice, it's because specs take profit quickly and real money takes some time before it springs into action.
I expect these breakouts to reassert themselves on Friday or (more likely) early next week.

