
Four separate highs and the 200 day MA are being approached.
Earlier I wrote about how the USDCAD was testing key support area and holding (see post here).
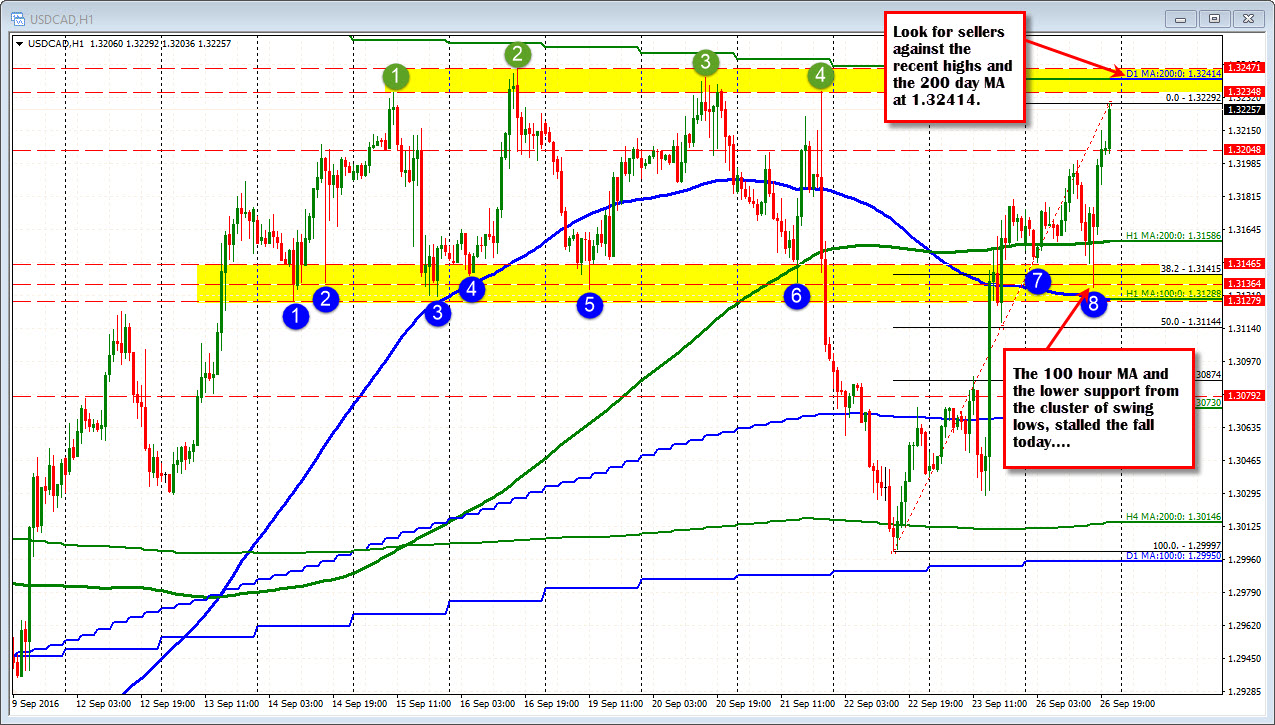
Four hours later, the price is moving closer and closer to the topside extreme defined by four separate swing highs (see green circles in the chart above) AND the 200 day MA that sits in the middle of those extremes at the 1.32414 level today.
As mentioned in the last post, I would expect that sellers would be happy to sell against the level on a test. Nothing changes as risk can be defined and limited against the area. As always though, a break above and look for the sellers to turn around and cover/ buy.
PS and sorry Adam for stomping on your USDCAD post... UGH!

