Latest govt borrowing figures now out
- +£7.5bln prev revised up from +6.9bln
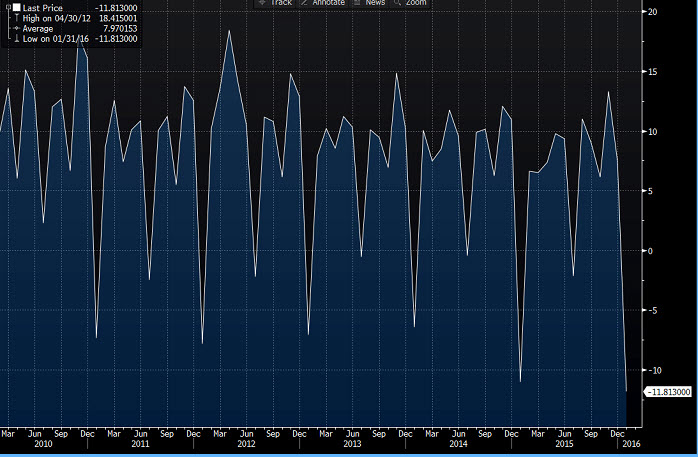
- PSNBR ex-banks £-11.210bln vs -£120.217bln prev
- public sector debt net banks £1.58trln equiv to 82.8% of GDP
- PSNCR (Cash Requirement) £-24.9bln vs +£8.5bln prev revised up from +£8.1bln
- central govt NCR £-20.2bln vs +£20.5bln prev
Largest PSNBR ex-banks surplus largest Jan reading since 2008. Surpluses are generally observed in the month of January due to the high tax receipts.
First annual fall in debt-to-GDP ratio since Sept 2002, based on early GDP estimates.
The amount borrowed by the public sector has been falling since the peak in the financial year ending March 2010
Says the ONS:
In January 2016, the public sector spent less money than it received in taxes and other income. This meant it was in surplus (or credit) by £11.2 billion. .
Of this £11.2 billion saving, £15.3 billion were saved on the cost of the "day-to-day" activities of the public sector (the current budget deficit), while it spent £4.1 billion on infrastructure (net investment).
Annual borrowing has generally been falling since the peak in the financial year ending March 2010. So far this financial year (April 2015 to January 2016), the public sector has borrowed £66.5 billion. This was £10.6 billion lower than at the same point in the previous financial year.
Full report here