EURUSD up. NZDUSD down. USDCAD wonky
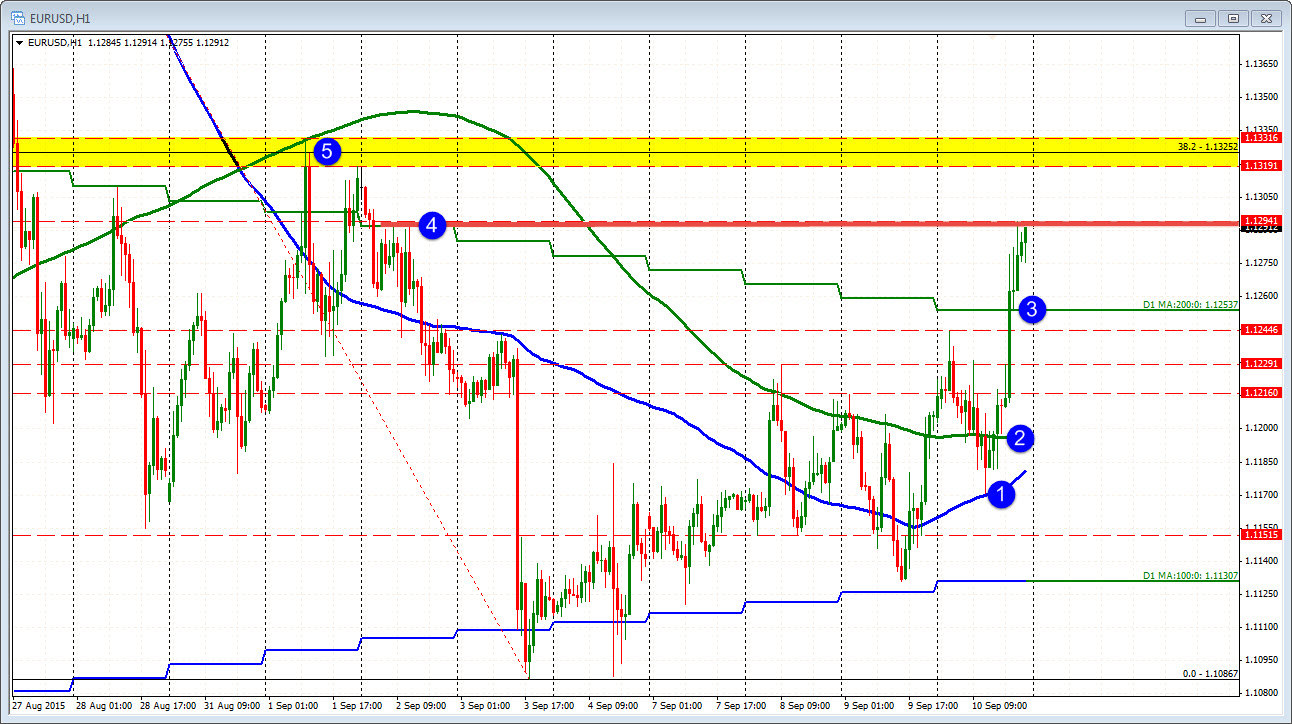
EURUSD. The NY session has seen the EURUSD transform itself. It started after it held the 100 hour MA. It continued after the price found support at the 200 hour MA (after breaking above), and then continued on the break of the 200 day MA and holding that level. The buyers remain in control. The pair moves toward the highs and there could be a test of the next key target at the 1.1319 to 1.13316.
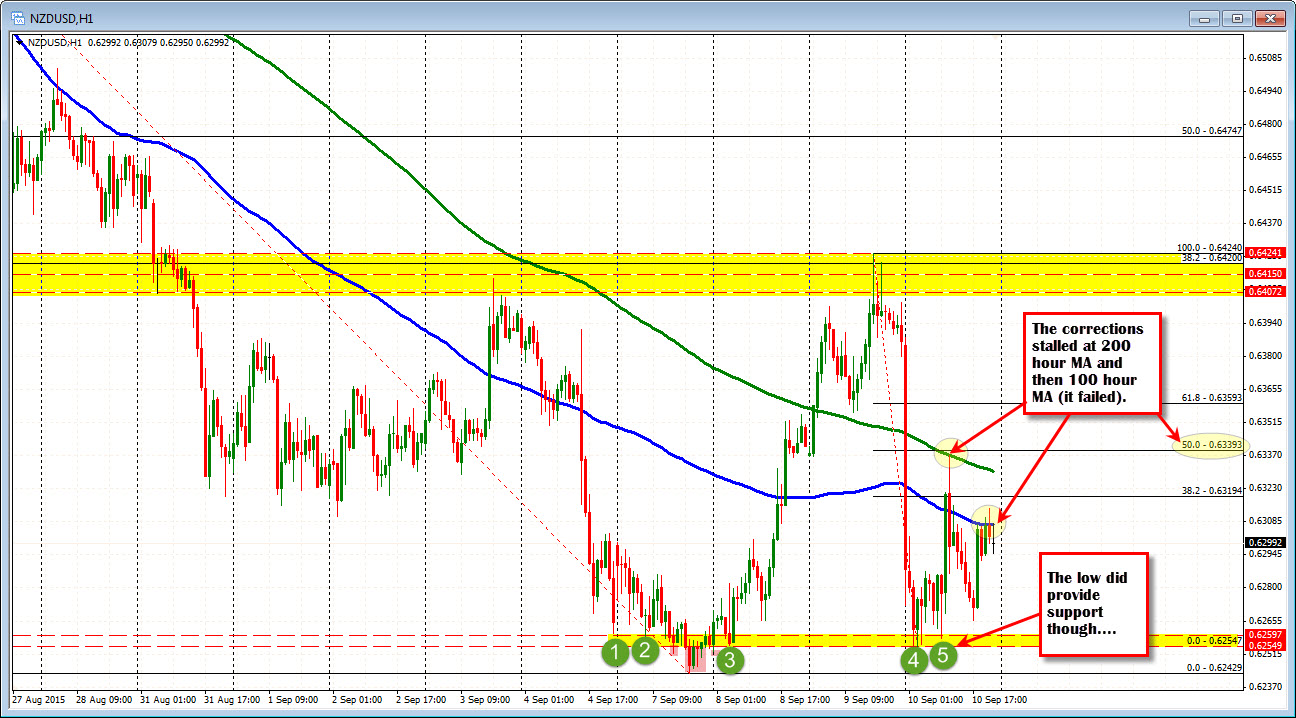
NZDUSD: The RBNZ got things started as the clock turned to the new trading day. The price tumbles all the way down to where the lows from Sep 4, 7 and 8 stalled (yes there was a lower low on Sept 7 but the next dip held above the low). That led to a correction higher that saw the 200 hour MA and 50% hold. Perfect. The lows could not be taken out in the NY session and the price corrected to the 100 hour MA. A failed break, above the 100 hour MA will pass the buck to the Asian Pacific traders. Let the locals decide which way it should go from here. Fundamentally should be lower, but may be priced in. Therefore, watch the clues from the charts....
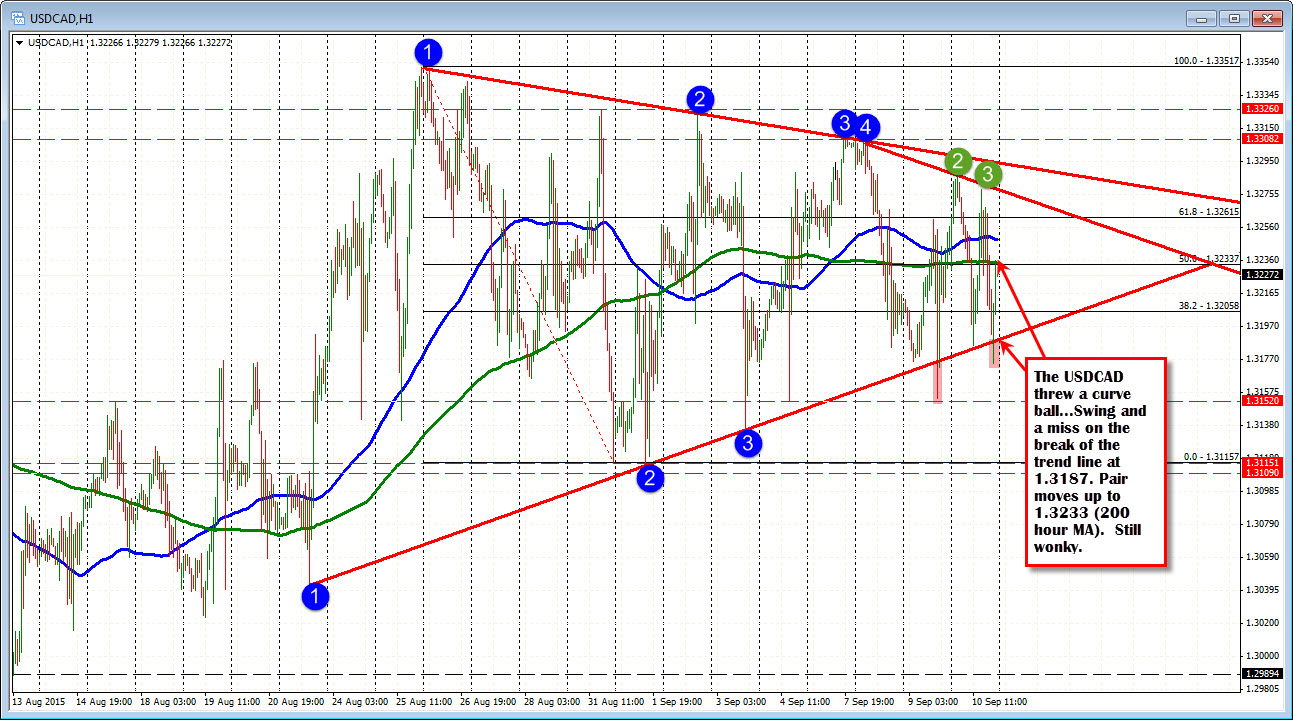
USDCAD: The USDCAD sure is wonky. Highs for the day stalled in front of an upper trend line. The lows saw the market throw yet another USDCAD curve ball. The break below the trend line and low for the day, led to a swing and a miss. The failure sent the price back higher in the last few hours of trading and right back to the 200 hour MA (green line).
North American traders pass the buck to the Asian Pacific traders.
It will decide what it wants to do eventually.
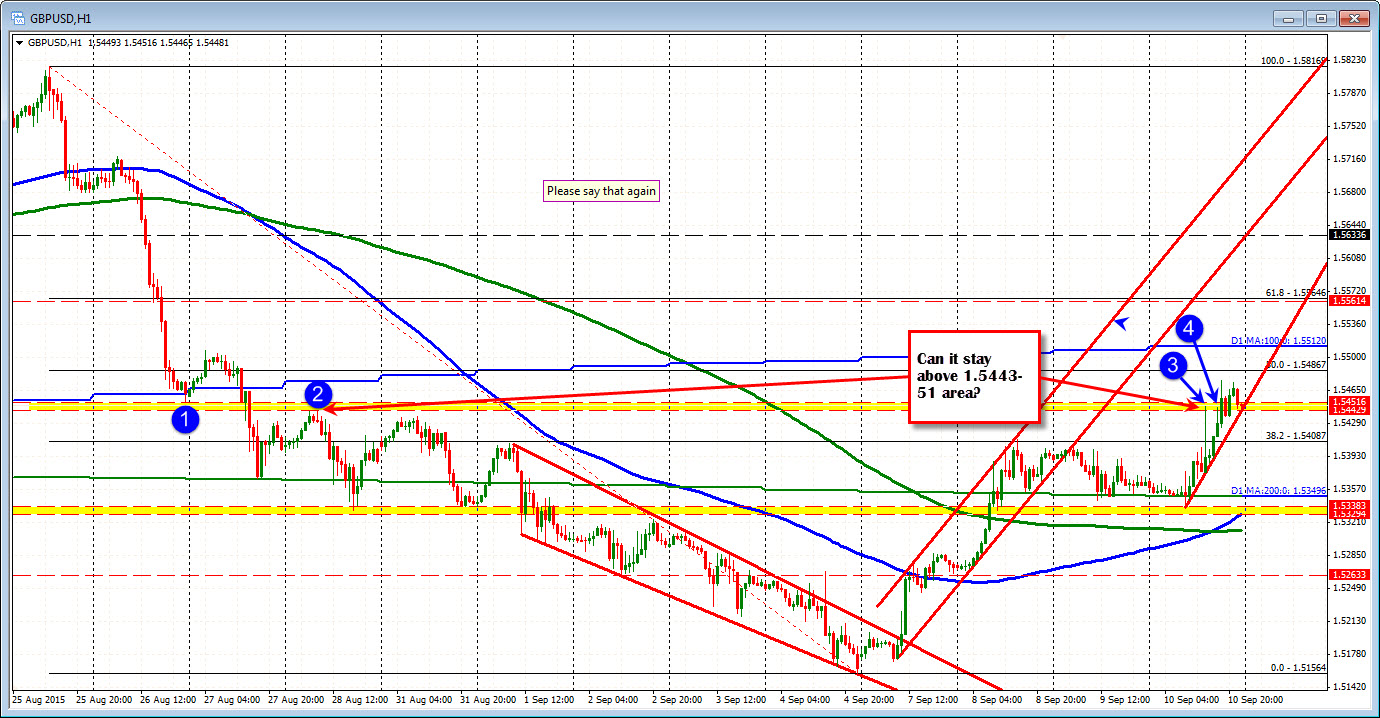
GBPUSD: BOE statement said that "global events haven't altered MPC central view". Then came the "But". That sentence read, "...but the greater downside risks to the global environment merit close monitoring for any impact on domestic economic activity" . So what is it BOE?
The GBPUSD went higher to resistance at the 1.5450 area. Then retraced, then extended above the 1.5450 level (really 1.5443-51 area - see chart below). Currently trading at 1.5448, the price is clinging to the lower support line. Hold and go higher to test 1.5486 and the 100 day MA at 1.5512, or head lower and call the rally over?
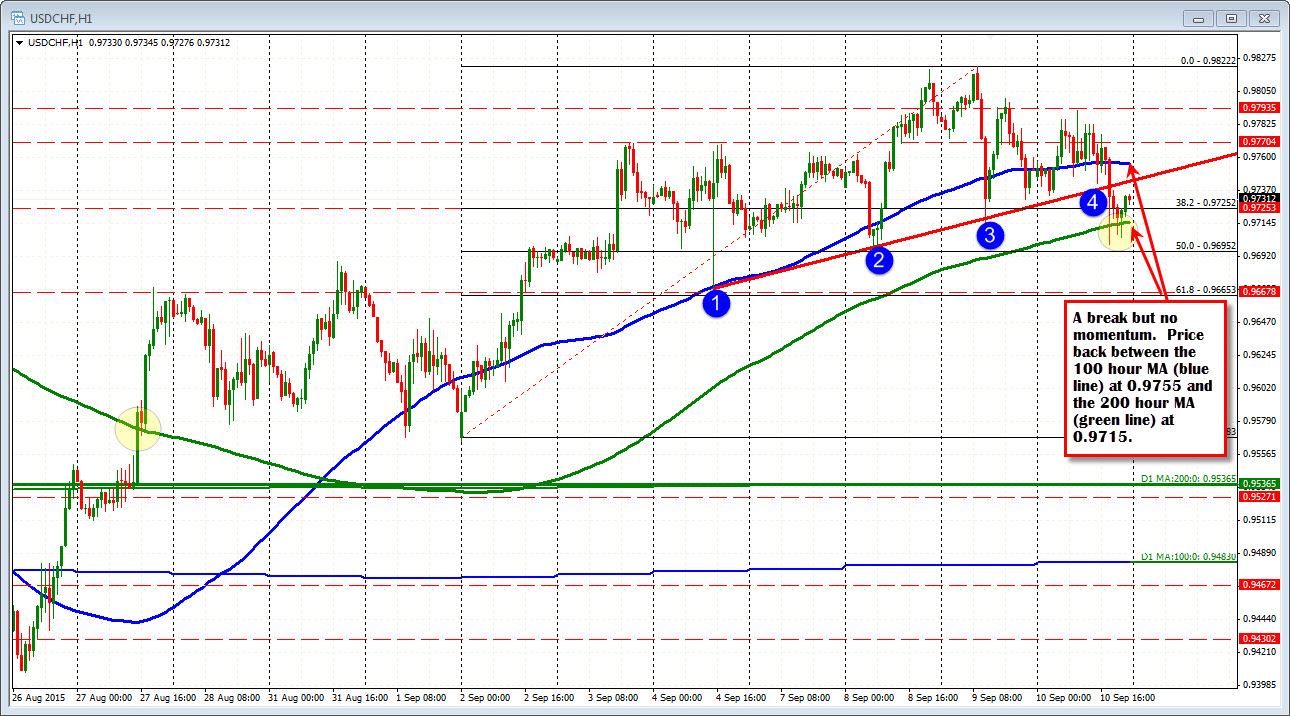
USDCHF: Dollar selling took the pair below the 200 hour MA for the first time since August 27th. Getting below and staying below was another story. No hourly bar close below the 200 hour MA despite three separate peaks. So the pair sits between the 100 and 200 hour MA (and below the broken trend line). The 100 hour MA at the 0.9755. The 200 hour MA is at 0.9715.The broken trend line is at 0.9742.