Risk is elevated
As with all key events risk is elevated through the US employment report. When, I talk about risk it includes market risk, event risk and liquidity risk. We always face market risk as long as the market is trading. Event risk is from some random number that comes out. Today with 330 million people in the US, the event risk will swing on 50K from the estimate of 180K. Who knows what that swing might be? Then there is liquidity risk. With today being the "last day of summer" (well US Labor day on Monday is really the last day), how much of the normal liquidity is out there. Be aware of your risk. It should matter (a lot), especially to a retail traders.
Having said that. here are some technical levels to follow in the EURUSD and why
EURUSD:
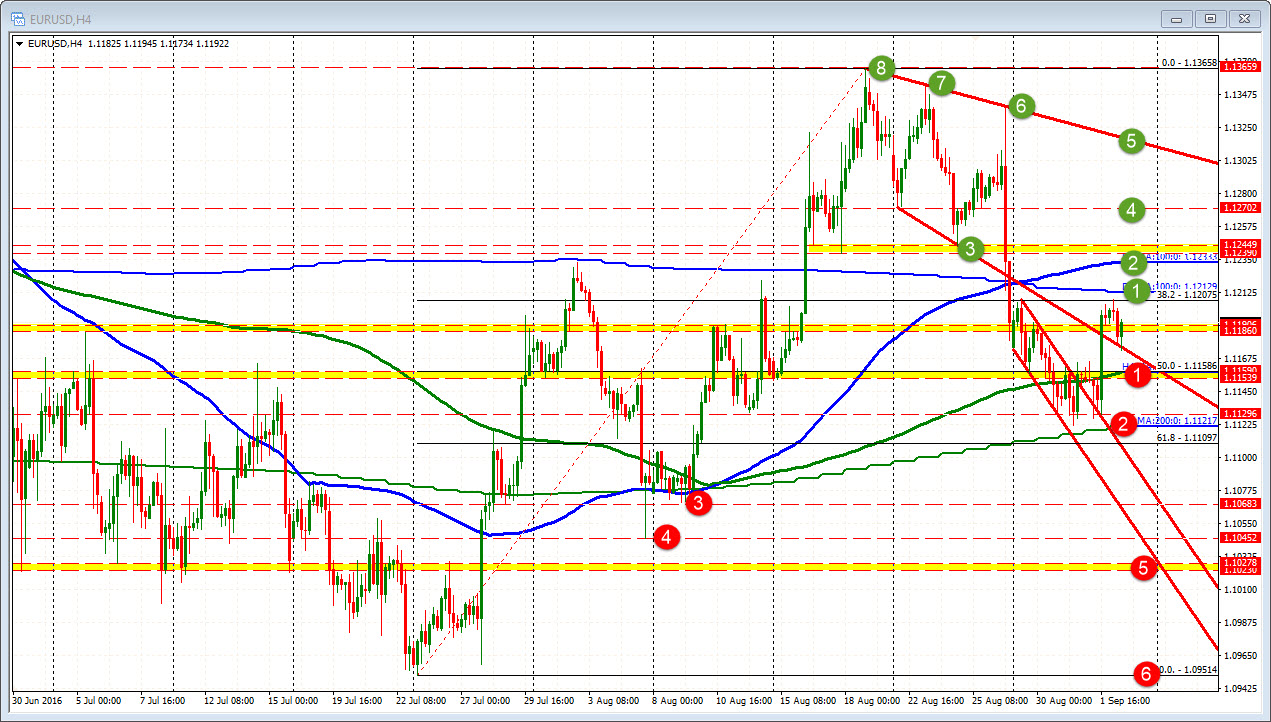
Post-Brexit day, the EURUSD ranges since then has been from 109.51 to 1.13658. The midpoint is 1.11586. The midpoint of the 2016 year (not shown is 1.1162. The 200 bar MA on the 4 hour chart is 1.1158 level as well. In reality a overly strong number could go to the lows for the summer. And a really weak number could go to the highs of the summer. They are 235 pips away to the downside low at 1.0951 but that is doable. ON the topside the high is 175 pip away. That is possible too on a very weak number. So be aware of that.
Anyway, the 1.1158-62 area is the is Bullish above/Bearish below line going forward. We are currently above but we don't know the number so it does not matter. It matters after the numbers for bias.
On the topside on a low number:
1.1213: 100 day MA
1.1234: 100 bar MA on 4 hour chart.
1.1239-45 were recent swing lows.
A move above that area, puts the pair, in the consolidation area from August 16 to August 26.
1.1315 is a level to eye. That is a trend line from the 3 most recent highs.
Above that and the market will gun for those three highs.
On the downside:
1.1158. SInce we are above the 1.1158-62 area. That is step 1.
1.11217: that is the 200 day MA. Yestererday and Wednesday, the price got close to that MA but did not break below. A move below should have that line act as resistance.
1.1068: There are some swing lows from end of July/early Augustt
1.1023-27. Some swing levels and low close before the extreme in the mid to end of July
1.09514. Low after Brexit days
USDJPY
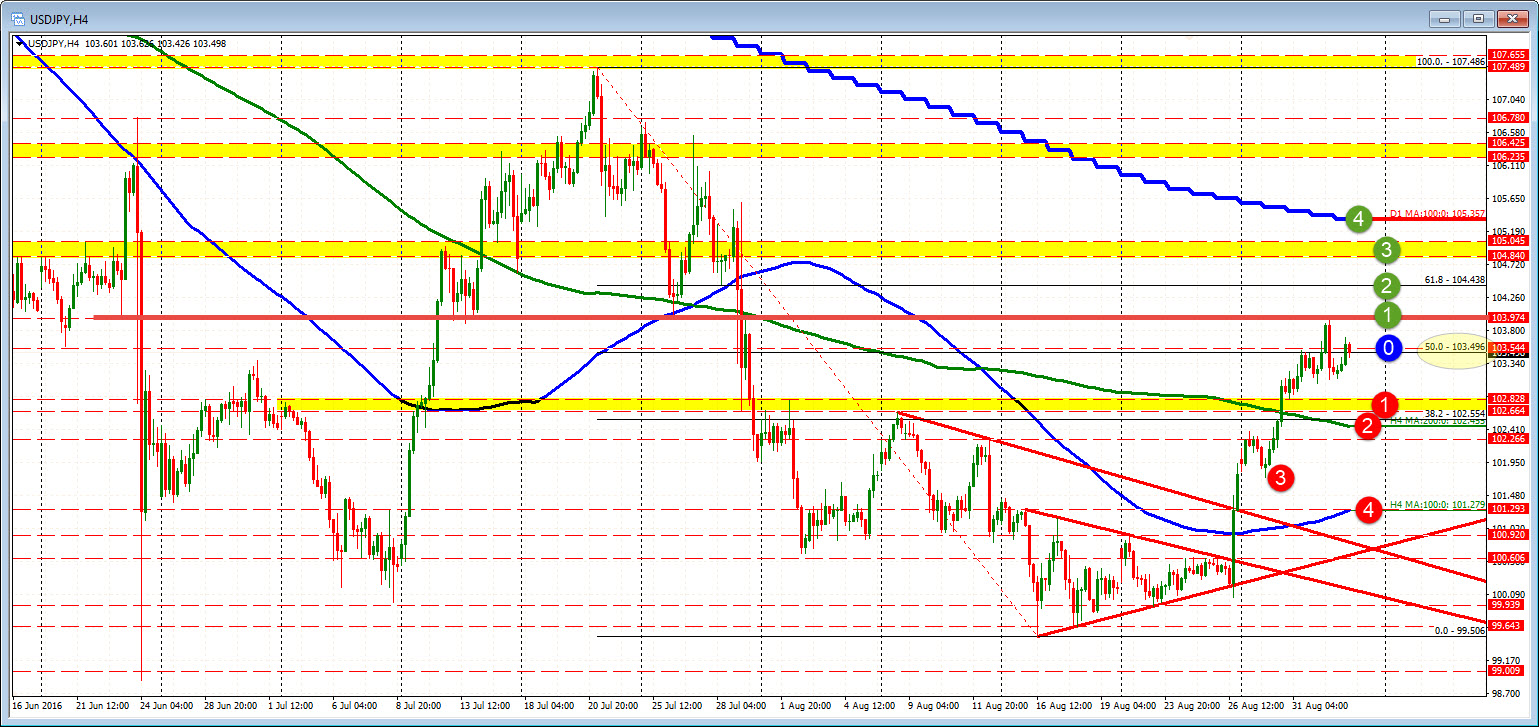
Here is the picture for the USDJPY with the 50% at 103.50 a key level that determines bullish for bearish bias. On the topside a key level to get and stay above is 104.00
On the downside, the 102.45 is the 200 bar MA on the 4-hour chart. Looking back, that MA has been a bullish above/bearish below line in the sand. So will be paying attention to it.
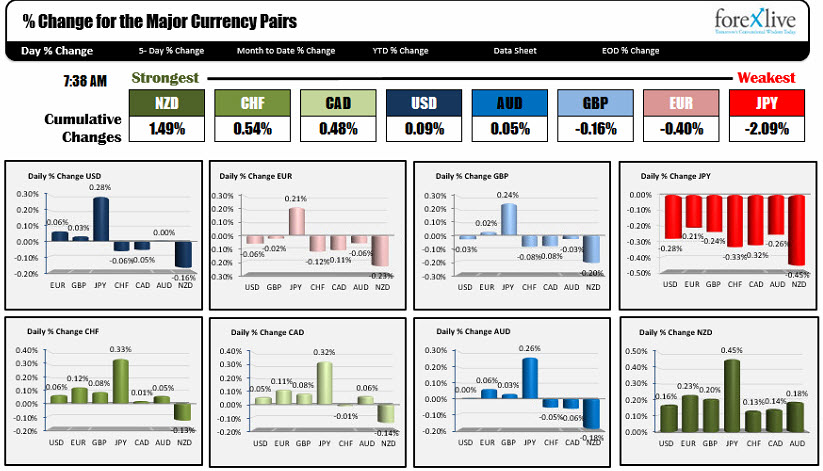
For good order sake, here is the snapshot of the strongest and weakest at the start of the day.