S&P up 0.86%.
The stocks are trading at the highs for the day as the up and down pattern continues.
The S&P index is up 18.6 or 0.91% . The Nasdaq is up 47.6 or 0.95% and the Dow is up 200 points or 1.17%
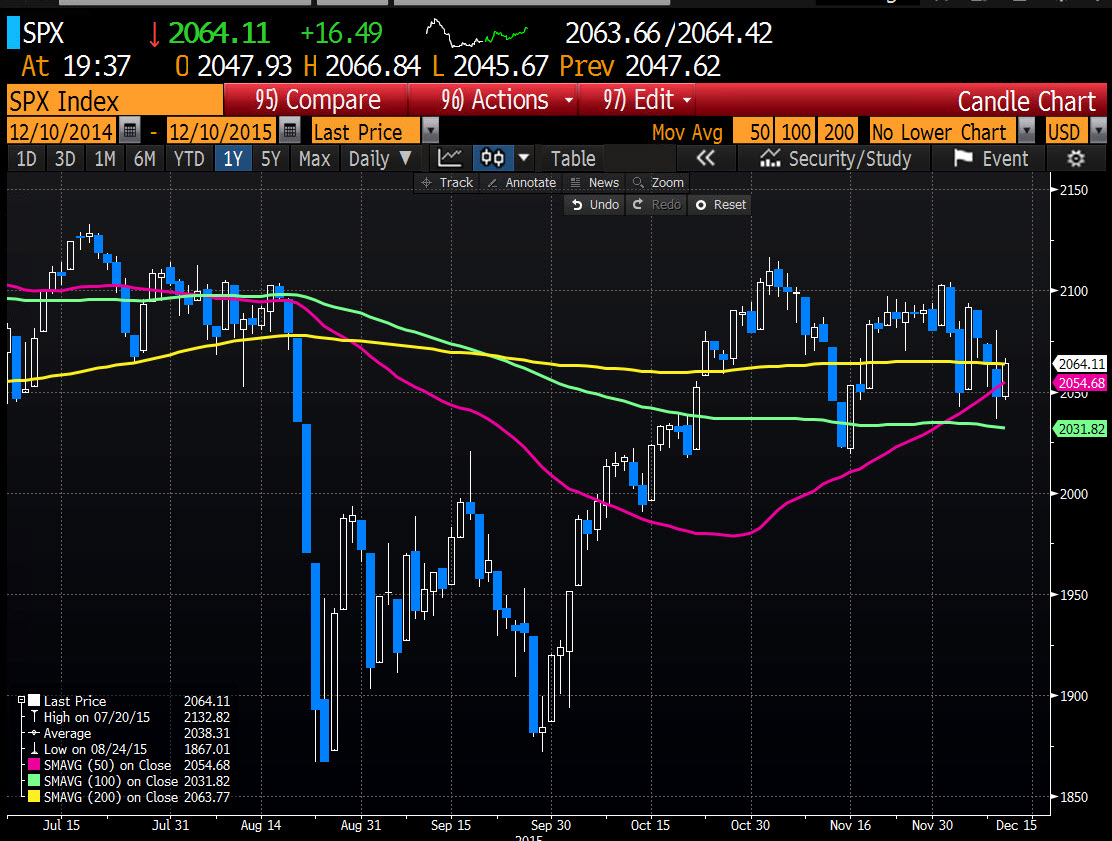
For the S&P this week, the index has been dancing with key moving average levels including the 50, 100 and 200 day MAs (see chart below). The uppermost MA is the 200 day MA (it is just going sideways indicative of the 2015 action). The level comes in at 2063.77. The price is trading just above that level now. I cannot really say a close above is bullish as the stock market is having trouble getting out of it's own way over the last few months, but perhaps there is some further follow through buying. The S&P has been down for three consecutive days. It closes at 2091.61 last Friday.