
S&P technical analysis: Index takes out low and bounces but stays below 100 day MA.
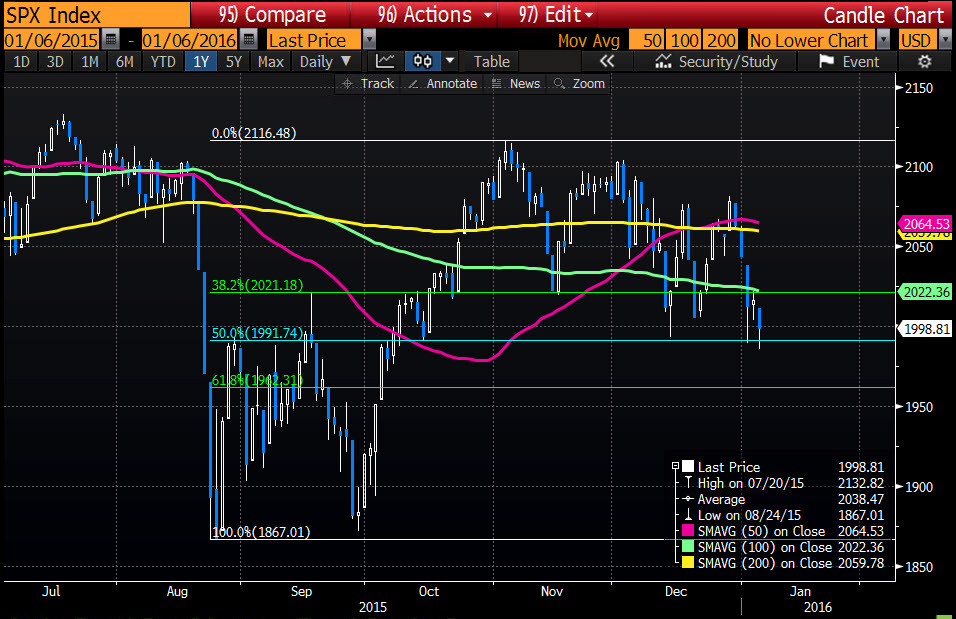
On Monday, the S&P took out the prior low from mid December and also fell briefly below the 50% retracement of the move up from the August low to the November high at the 1991.74 level. That break was short lived and the price rebounded. Yesterday, the index rallied to the 100 day MA (currently at 2022.36 - see chart below) and stalled right at the level.
Today, stocks opened sharply lower and again a new low going back to October was made. The 50% was broken as well. And once again, the price has rallied.
Stocks seem to be flirting with disaster. However, what we do know is the two breaks below the 100 day MA in December, two days later were comfortably back above. This is the third day and the rally off the low has been limited. So be careful. Keep an eye on that 50% retracement line.
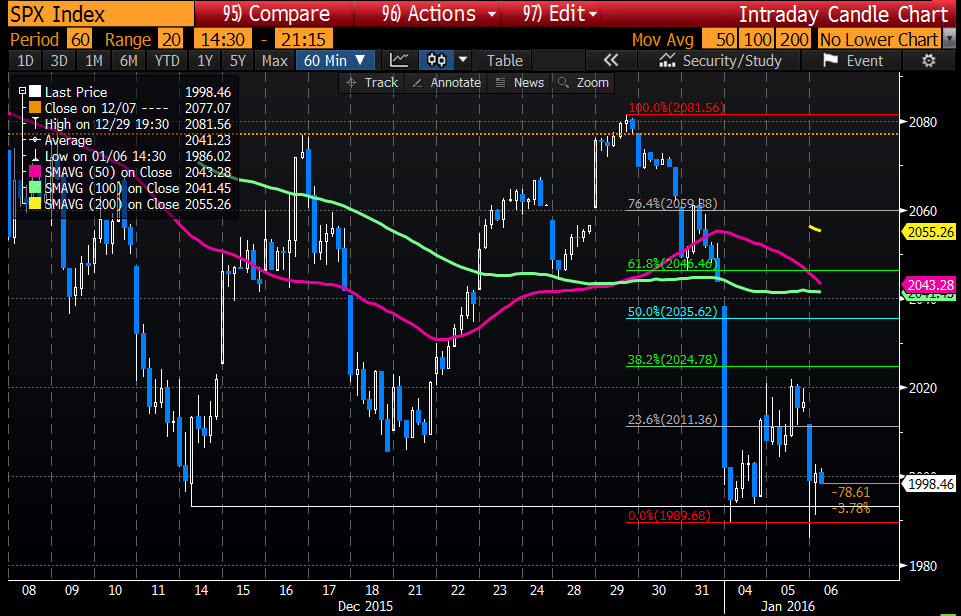
Looking at the hourly chart below, the tumble lower from the end of December high corrected yesterday but fell short of the 38.2% retracement. Remember it also fell short of the 100 day MA. That too is pointing to a more bearish bias.
Is the New Year bringing a new attitude for US equity traders? The dips tend to be bought - or at least that has been the pattern. Having said that, the technicals are not showing too much of a bullish thing so far in 2016.

