
The 1925.50 area eyed by traders today
The S&P and global stock markets are being pressured again today. What do the technicals say for the S&P index?
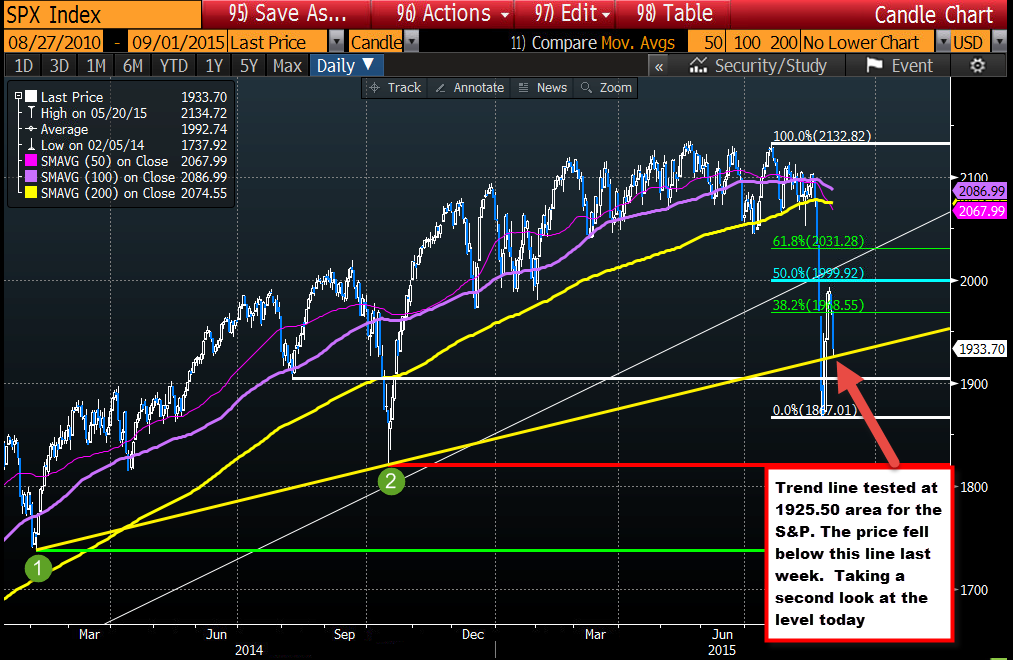
Looking at the daily chart, the price correction off of last Monday's low held resistance under the 50% retracement level at the 1999.92 level (call it 2000). The high corrective price got to 1993.48 before turning back to the downside in trading yesterday. That keeps the bears in control.
The tumble today has the index testing the old trend line connecting the February 5th and the October 15th lows. The price did tumbled below this trendline last week, but reversed. The market will give the line a second chance to hold, and today, the price is so far holding. This could be a signal that buyers put a toe in the water against a risk defining level.
Does it mean, the market is out of the woods?
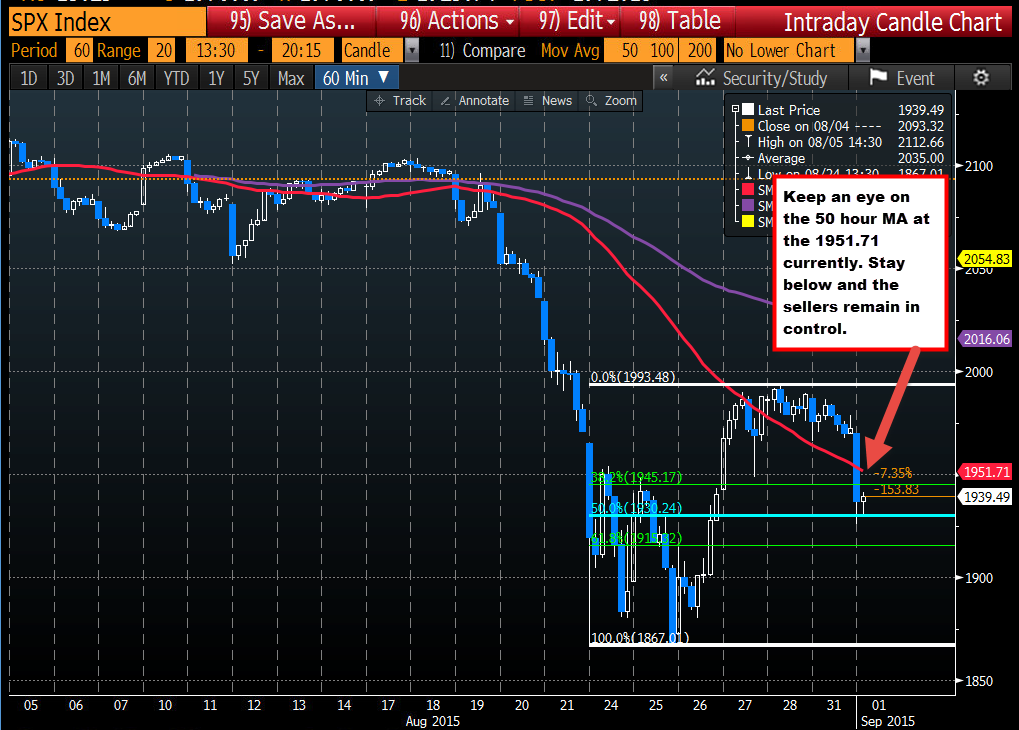
Not just yet. Looking at the hourly chart, the price decline today dipped below the 50% of the move up from the lows at 1930.24. I don't like that but the price quickly rebounded off the trend line support on the daily chart. So, the price is back above that level.
The bearish news, is the 50 hour MA (I like to include the 50 bar on stock charts) comes in at 1951.70 currently (see red MA line in the chart below). If the correction cannot extend back above this MA, the sellers remain in control. A move back below the 1930.24 and then the 1925.50 area could lead to some additional selling momentum.
PS. The Nasdaq composite is now negative on the year.

