Lower highs keeps the bears in control going into the meeting decision in the new trading day.
The RBA is expected to keep rates unchanged at a record low 2% in the new trading day. The economists projections are unanimous.
So what are the technical telling us?
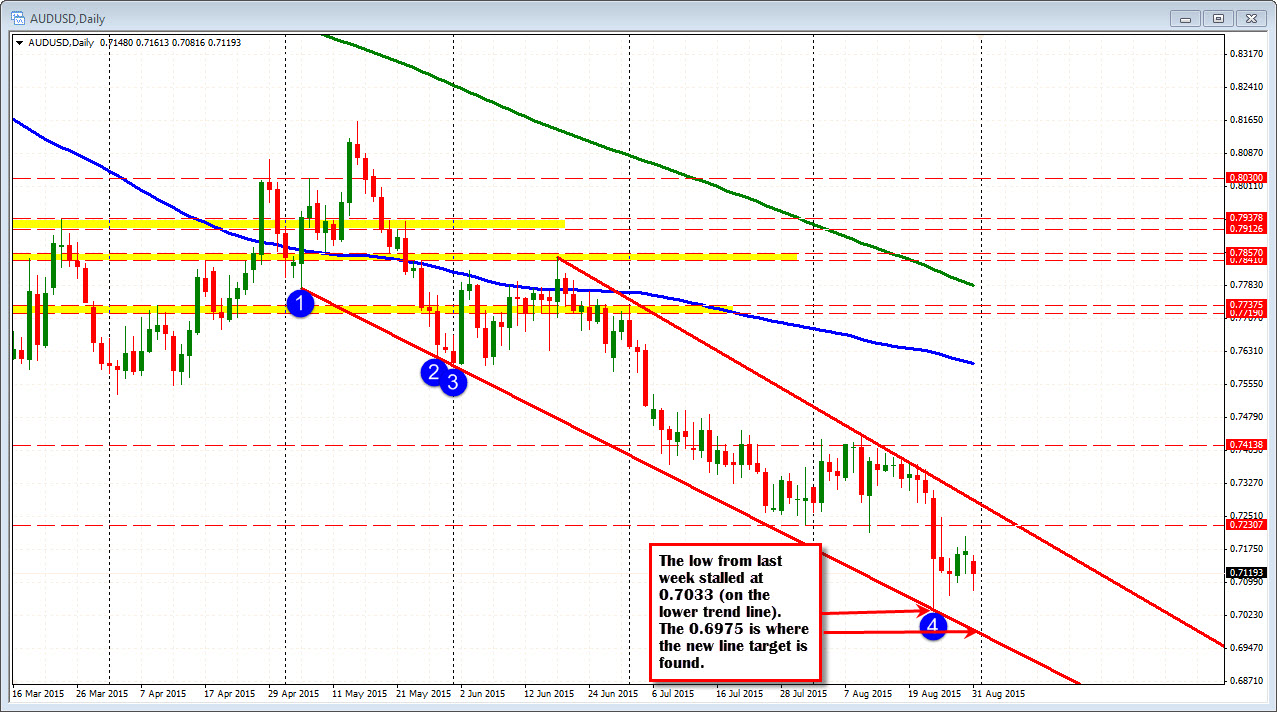
The price is down. The AUDUSD is trading near the lows going back to April 2009. The low price this month came in at 0.7033 (the Dow down 1000 day). The lows since that day came in at 0.7068 on Wednesday of last week and then 0.7081 - which was the low reached today.
When the traded price is near multi-year lows, those recent lows become the most obvious targets. So 0.7081, 0.7068 and 0.7033 are the first main levels to get and stay below.
Where does the AUDUSD go on a break of those levels?
Looking at the daily chart, a move below 0.7033 will next target the natural support at the 0.7000 level and then a lower trend line at around the 0.6975 area. That trend line has a number of successful tests. Last week tumble was stalled right on that line.(see daily chart above). Clearly, the market had then level pegged. So it would not be surprising to see the market stall near this line should the bearish bias continue for the pair. Also understand, however, that lower lows keep the bears firmly in control in the pair. SO respect the trend if the momentum continues through that line. I would expect stops to be triggered.
Can all the bad news be in the price?
With China still remains a wild card that is not really positive for the Australian economy or currency. In addition, the potential for fallout from other emerging economies is another negative that makes the downside seem the easy way to go. The Fed is still expected to raise rates in 2015 while the trajectory in Australian rates are still to the downside. However, growth and employment still remains positive despite the fallout from the mining sector. So it is not all bad. Remember also that last month the currency got a quick boot higher on less dovish comments (about 140 pips higher).
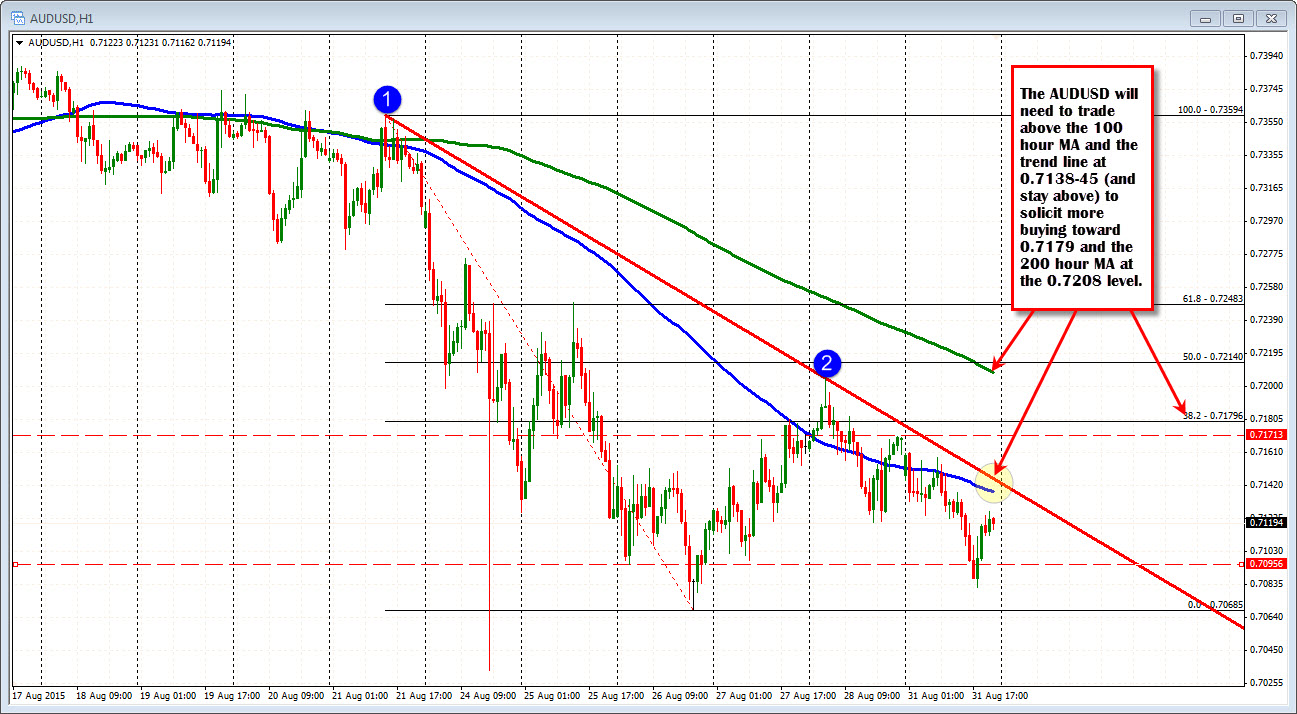
On a move higher look for a break of the 100 hour MA (blue line in the chart below) and trend line as the next targets to get and stay above. Those levels come in at 0.7138 and 0.7145 respectively. A move above that and the 0.7179 (38.2%) and 200 hour MA (green line in the chart below) at 0.7208 will become the next upside targets. A move up the 200 hour MA is only 90-100 pips from the current trading level. So it is doable target. On a move above the level could see some further upside momentum on short covering.