
Stock declines becoming more of a barometer lately
The last 6 trading days has seen the up and down alternate in the USDJPY pair.
Last Thursday, the USDJPY closed higher. Then lower on Friday, higher on Monday, lower on Tuesday, higher on Wednesday and lower today.
I thought yesterday's strong move higher yesterday - and away from the 100 day MA and above the September high at 104.31 was the straw that would break the up and down camels back but weaker China trade data and subsequent lower stock prices hurt that idea as the Pavlovian reaction of late is to sell JPY pairs with stock market weakness.
The price fell back below the 104.31 and tumbled back to support.
What support?
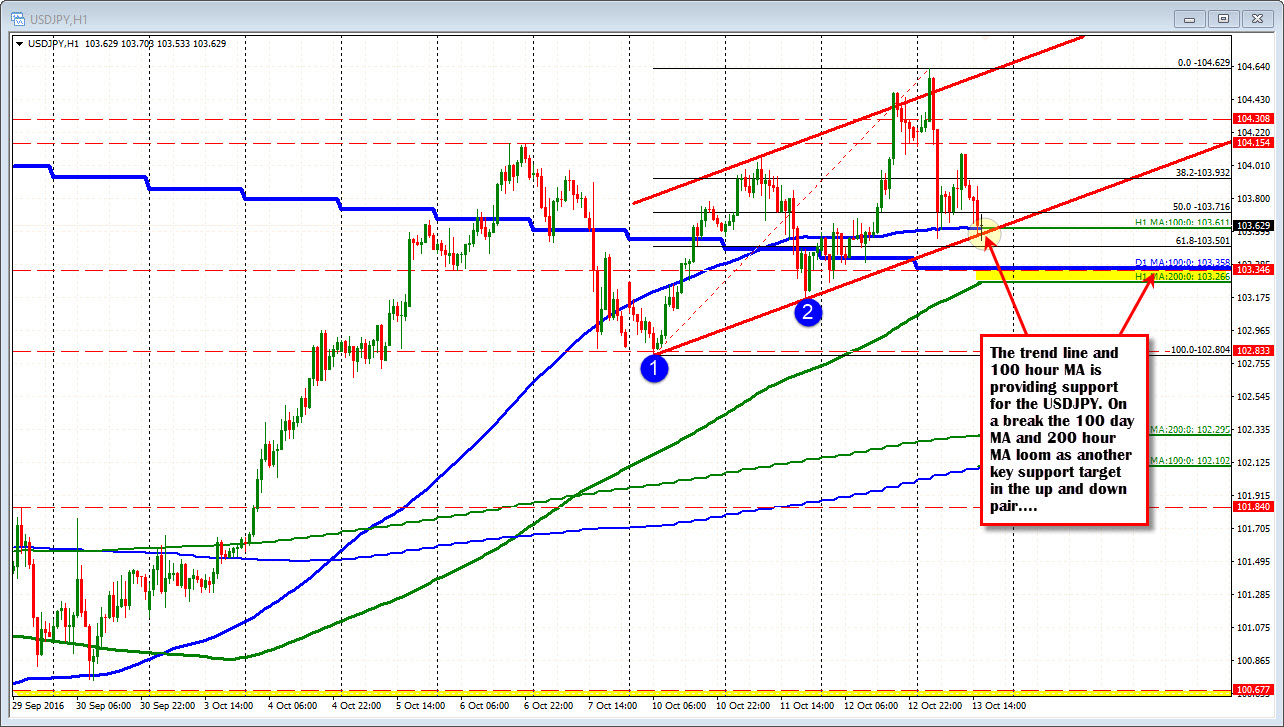
If you look at the hourly chart, the low is stalling near the lower trend line at 103.59, and the 100 hour MA at 103.612. That is the initial support target. If that is broken and selling continues (watch stocks?), the 100 day MA and the rising 200 hour MA (at 103.359 and 103.266 respectively) will be targeted. That should provide support.
We know the price has alternated higher and lower over the last 6 trading days. Well, the last 5 trading days (even yesterday with the run higher), has traded above and below the 100 day MA at some point. That should not happen unless the market is thinking "we made it to the key MA line finally (remember it had not been above since early February), it is not time to be hasty". In other words. It is time to consolidate and think about the next move. Is the next move more dollar strength on a Fed tightening or do stocks unravel and lead to the flight into the JPY?
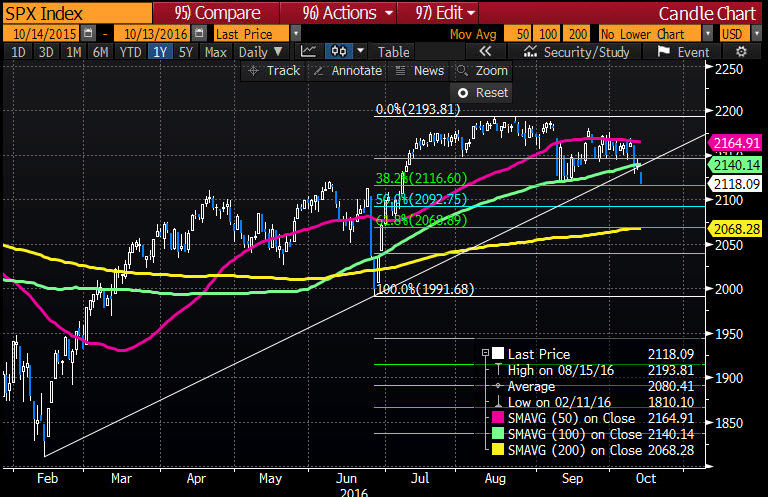
The S&P stock board is showing lots of red on it today (S&P futures are down -18.5 points or -0.86%). The price of the S&P is below the 100 day MA at 2140.19 (currently trading at 2120.47). That should be more bearish for the USDJPY. It "should", but will traders lean against support right here and push the price back higher. Claims data continued to show that employment remains strong and that should encourage the Fed to act when they can.
The good news for traders is that risk can be defined against the technical levels.
What seems to be clear though is trading in this pair can sure have it's ups and downs. So be patient. Pick your spots and if the market agrees, you should make a few pips, but it may not be the time to be too greedy. The sentiment changes with the wind in this pair of late (one day bullish/one day bearish). That pattern may change of course but let the price action tell you. And if it does break, make sure it does not fail.

