
USDJPY forex technical analysis
While the pair keeps knocking out old highs perhaps it's time to have a look at the long term tech that could get in the way of the dollar steam roller
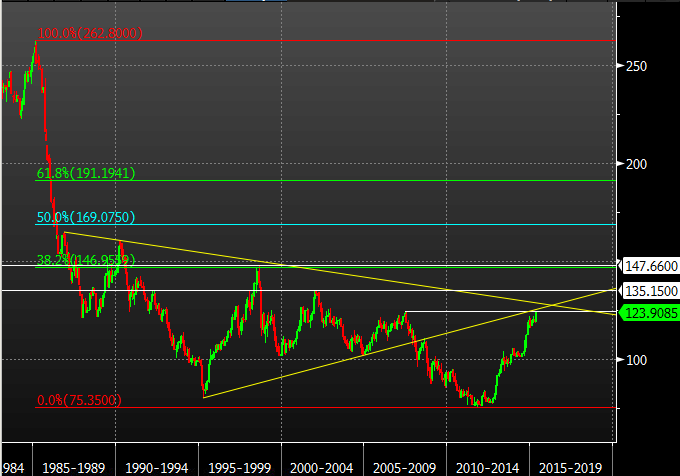
USDJPY monthly chart
The June 2007 high was busted by a few pips and we've been back below by 70 pips. Above that high we have the broken Apr 1995 trendline at 124.92. The 125 level is one that a lot of people have their eye on. From there we have the trendline from Nov 1986 through Apr 1990 at 128.63. After that we have the Jan 2002 high at 135.15. The biggest level as we move up is the 38.2 fib of the Feb 1985 fall from 262.80, which comes in at 146.95. That's in close proximity to the August 1998 high at 147.66
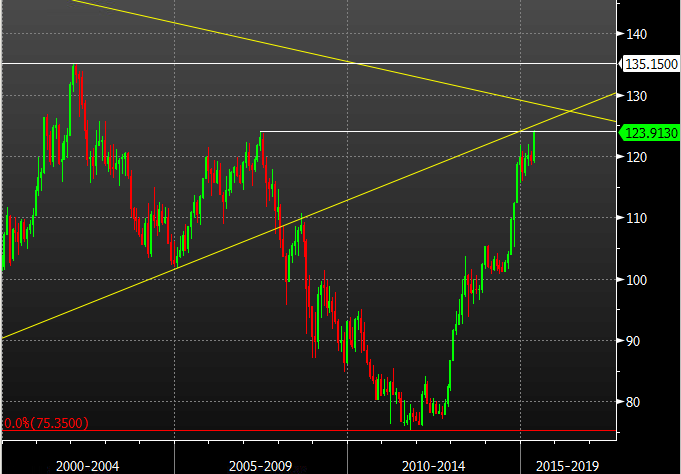
USDJPY monthly close up
If there's one thing I love about trading tech it's the big long term levels like these, and particularly the fibs. They can be very profitable if they hold. Don't believe me, then pull up your monthly charts and draw fibs from the 1998, 2002 and 2007 highs down to the low in the 75's and look at how the price behaved at the fibs on the way back up
A look at the wider picture can also put current moves into context. Think we've come a long way since the 75's? We've still got 1200 pips until the first fib of a 30 year move south. Go back even further to where Bloomberg has their first prices in 1971, at 358.44, and the 38.2 fib comes in at 186.21, some 6300 pips away
The thing with long term technical levels is that they don't come around that often so when they do they're worth paying attention to. The other important factor to note is that you can rarely expect the price to stop on a dime at these levels. Quite often you may have to give yourself maybe 50-100 pips of overrun. There's no trading these levels with a 20 pip stop so you have to manage your trade accordingly. I'm quite happy to risk a bit more on these types of trades because there is usually a decent risk reward ratio
And that brings me right to one of the basic lessons when trading the tech. I always assess the underlying market at the time. You can't just say "there's a tech level, I'm trading it" without asking what the price is doing, and the reason why the price is here at this moment in time. Those questions are important as the tech might not stand up against the reason why a market is moving to a level.
Let's look at why the price is here. US interest rates. The market and the Fed are ready for hikes. The market is still moving because it doesn't know when hikes are coming and wants that confirmed. The expectation is driving the price. Very rarely do you move 500+ pips on what will effectively be a 25bp hike. Most cases you'd be lucky to get 200 pips on an unexpected move of that size let alone an expected one. So, the uncertainty of lift off and the fact the market wants to believe it's coming is what's behind these moves. My first thought is that we're now entering an overexcited point and any additional large gains from here will be a complete overpricing of a 25bp hike. If that does happen then when the Fed does pull the trigger the market is not going to spike up another 500 pips. If anything we'll consolidate or fall after the event
So what levels will I be looking at for a trade?
Unless we get a really decent dip I've got no interest in chasing this at the top so I'll be looking to trade shorts from the higher tech. The 125 area looks promising for this run as another 200 pips will look very overdone. That 1995 trendline looks good to lean against and there's (not noted on chart) the Oct and Dec 2002 double top at 125.66/70. That gives two strong levels to trade from. If I get in there then the least I would be looking for is a retest of 124-123.50. If we carry on higher then a break of 126 would have me throwing in the towel. Of course, if we do break then I would look a those broken levels to turn into support, and therefore look for a long trade from them
There we have it. Some technical levels to be aware of both for traders looking to short, and longs looking for where the price might stall. Remember, the tech is just as important if you're in a trade as it is when you're not, as it can mark a point that brings your run to an end

