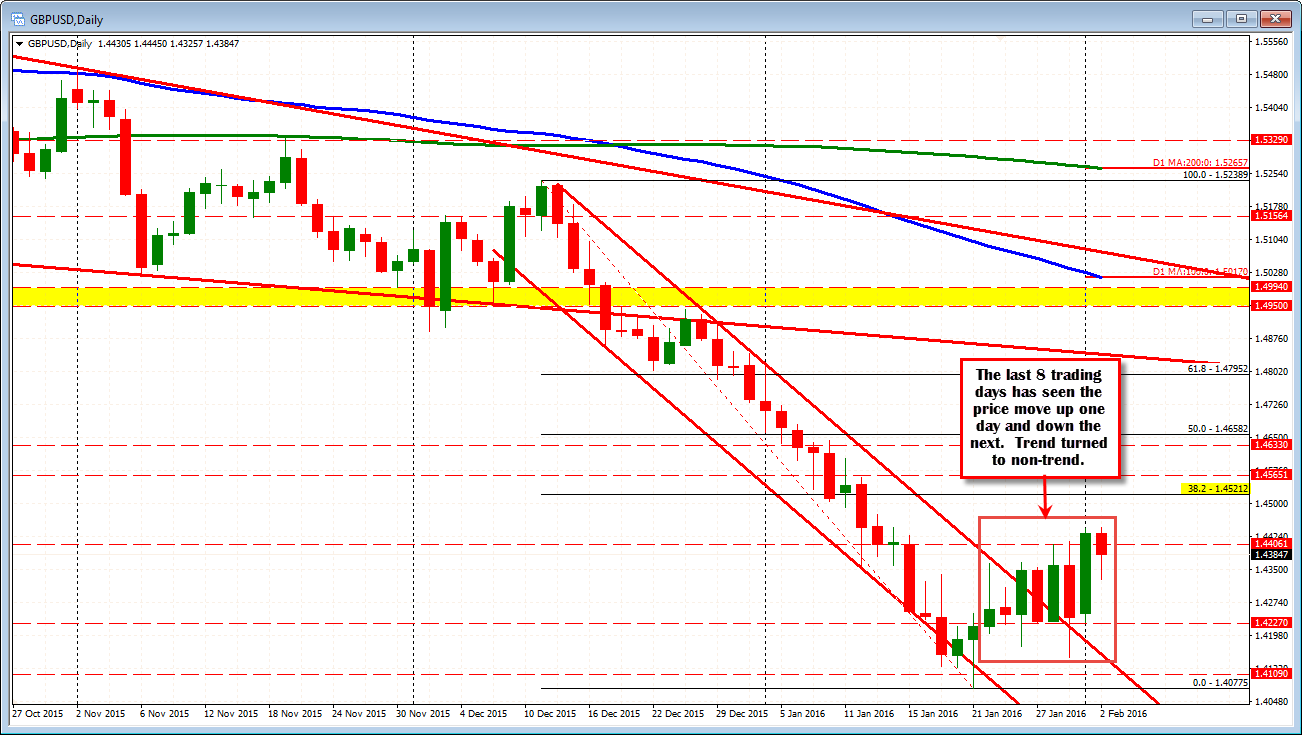
8 days of up and downs
The GBPUSD has been up one day and down the next over the last 8 trading days. The pair closed at the 1.44315 yesterday. It was near the highs. Today, there was a push to new corrective highs at 1.4445 (yesterday's high reached 1.44438). The price has moved back lower over the last few hours and back below that closing level. Down on the day. Fits the pattern.
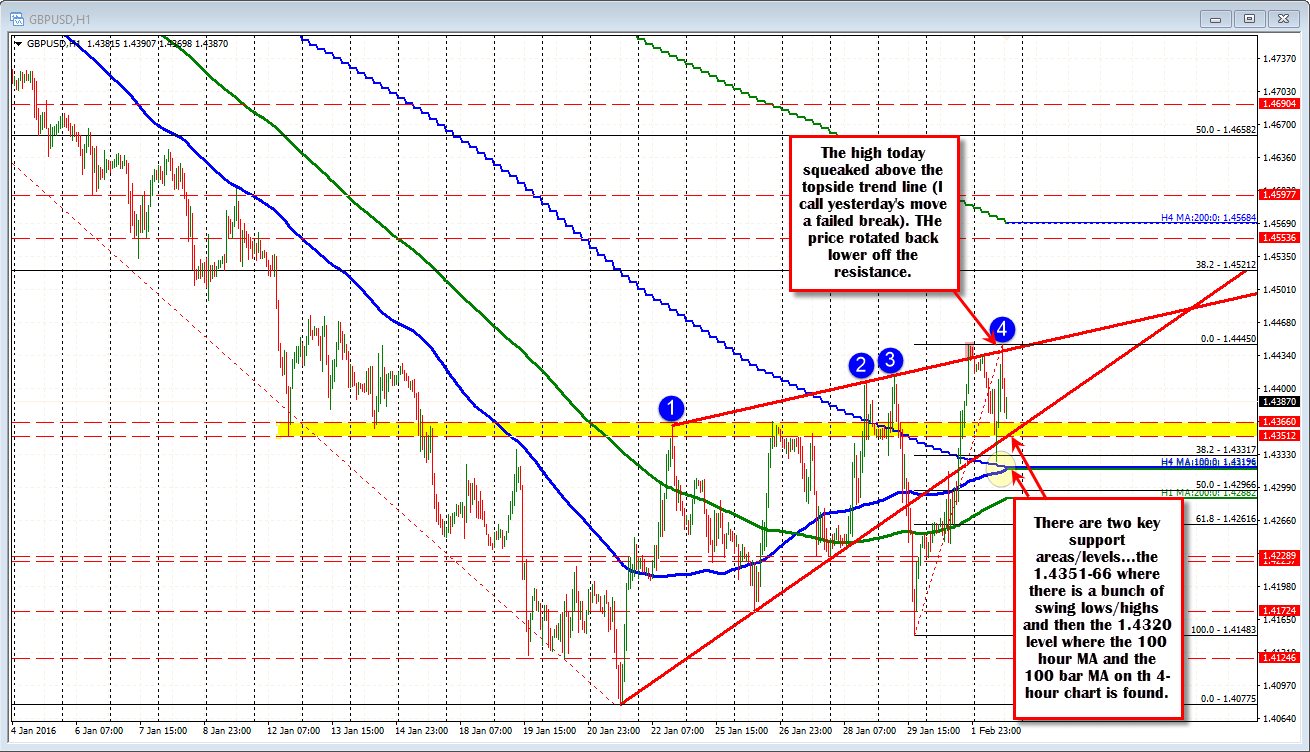
Looking at the hourly chart, the pair is approaching a support area at the 1.4351-66 area. That area corresponds with swing lows and swing highs and a broken trend line (see chart below). Look for buyers to lean against the level on the test.
Another key support level - should the 1.4351 give way - comes in around the 1.4320 level. This is where both the 100 hour MA and the 100 bar MA on the 4-hour chart have converged (see chart below) Earlier today, the low (after the construction PMI bounced nicely off this level). Traders who were aware of the level, took advantage of the low risk trade.