Forex news for trading on March 24, 2017
- US Crude oil futures down $0.11 to $51.36
- Dollar falls but recovers a bit after FOMC meeting minutes
- FOMC meeting minutes: Balance sheet plan would raise rollloff caps every 3 months
- CAD is the strongest into the NY afternoon trading. Fed minutes to go....
- US Treasury sells 5-year notes at 1.831% vs 1.840% WI
- Russian energy minister confirms that OPEC committee recommends current output quotas
- US crude oil inventories sees drawdown of -4432K vs -2000K est
- USDCAD moves lower after BOC decision. Trades at lowest level since April 24
- Canadian dollar jumps after BOC takes a more-optimistic tone
- Full text of the Bank of Canada statement May 24, 2017
- Existing home sales for April 5.57M vs 5.65M estimate
- Bank of Canada holds rates at 0.50%, as expected but offers nod to better economy
- ESM paper on Greek: Won't need debt relief if....
- FHFA House price index up 0.6% vs +0.5% estimate
- UAE minister: UAE ready for six or nine months extension of oil output cuts
- ECB Draghi: ECB remains vigilant on financial stability risks
- US Fed's Harker says every FOMC meeting is on the table for him
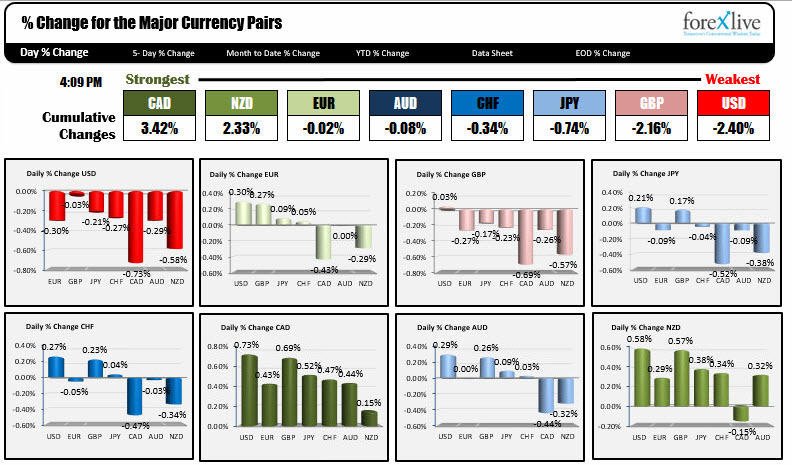
- The strongest and weakest currencies as NA traders enter for the day
In other markets:
- Spot gold is trading at $1257.88, up $6.74
- WTI Crude oil is trading at $51.27 in after hours trading. That is down -$0.19 or -0.37%
- US yields: 2 year 1.289%, -1.3 bp. 5 year 1.7901%, -3.6 bp. 10 year 2.2536%, -2.6 bp. 30 year bonds 2.9299% down -1.4 bo.
- US stocks are ending the day near highs for the day.
Another quiet day on the economic front in the US:
- FHFA house price index for March showed prices continuing to increase with gains of 0.6% for the month. The data had little market impact
- Later, there was additional housing data in the form of existing home sales. The annualized sales pace was lower than expectations at 5.57M vs 5.65M estimate (and 5.70M last month), but the story of low supply continues to put a limit on the sales. Buyers want smaller, more affordable houses. There are not enough out there and builders are not adding supply.
- Oil inventories showed a greater than expected draw down this week, but the price of oil fell back. The support against the 100 day MA around the $51.00 level held however.
In Canada today, the BOC kept rates unchanged at 0.50% once again (it's been since July 2015). The commentary in the statement was a bit more hawkish. That kept the buyers of CAD in charge for the day. The USDCAD peaked today against the 100 hour MA at 1.3543, retested that MA into the rate decision and moved lower (higher CAD) into the close. The pair is moving toward the 1.3400 level now (currently at 1.3417).
The trading was very subdued (sans the USDCAD and CAD pairs) for most of the day. However, the FOMC meeting minutes (which were released at 2 PM) had the potential to stir things up a bit. The headlines showed that the Fed was indeed serious about tapering, but they provided little in the way of details (except to say it would be a slow process). As far as tightening, the expected June hike was on track (although with a data caveat still). Employment was good. Inflation dips were transitory, with hopes/thoughts it would move higher but not race away from the 2% target. Weak Q1 GDP was expected to rebound (another transitory aberration in the economy).
The dollar went lower, recovered, but is moving back down into the close. In fact the dollar is the weakest currency of the majors (falling against all the major pairs).
For the EURUSD, the pair moved back above its 100 hour MA at 1.1190 and then above the 1.1200 level. Those levels will now be eyed as support in the new trading day. A lower risk level for longs will be at the 1.1160-71 area where swing level over the last week, and the low for the week is found.
The USDJPY is down testing the 100 hour MA at 111.447 into the close. The 200 bar MA on the 4-hour chart is below that at 111.288. The 100 hour MA was broken in trading yesterday so there may be some support against it in the early Asian session. Be aware.
The GBPUSD IS trading back above the 200 hour MA at 1.29548. This pair is not trading all that well. There is a lot of choppy action. The hard ceiling for me comes in at the 1.2990-1.3000 level. If there is a rally toward it, look for sellers. On the downside a trend line held support at the lows (hourly chart). That comes in around the 1.2929 level and moving higher).
Below is a look at the strongest and weakest for the day. Have a great new day!