
Forex trading news for June 16, 2017
- US stocks end the session mixed/little changed
- CFTC commitment of traders: EUR longs at highest level since 2007.
- EURUSD still can't get above 1.1300 post election high this week, but...
- US crude oil settles at $44.74
- The dovish shift from Kaplan is more than Yellen indicated. Watch for others to join in
- The key events and releases scheduled for next week
- More Kaplan: Fed should be very cautious, and patience in raising rates further
- DUP's Foster: Hopes to conclude talks with UK PM May as quickly as possible
- Baker Hughes oil rig count 747 vs 741 last week
- Former German chancellor Helmut Kohl dead at 87
- Mark Carney's Mansion House speech will be released Tuesday
- European stocks end the session higher
- Fed's Kashkari explains his dissent
- NY Fed Nowcast for 2Q GDP is down to 1.9% from 2.3% last week
- The Atlanta Fed GDPNow estimate for 2Q growth falls to 2.9% from 3.2%
- US May labor market conditions index 2.3 vs 3.0 estimate
- U Mich preliminary June consumer sentiment 94.5 vs 97.1 expected
- Amazon is the embodiment of the new corporate-deflationary normal
- Credit Agricole still upbeat on USD/CAD
- Canada international securities transactions 10.6B vs 15.05 B last
- US May housing starts 1092K vs 1220K expected
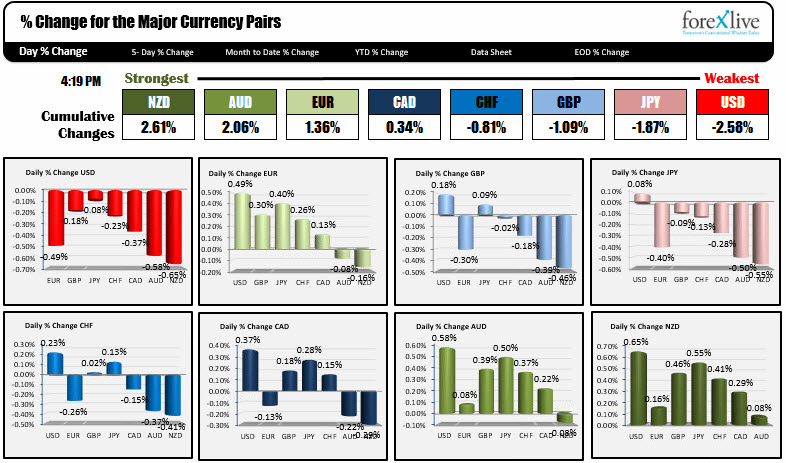
- The strongest and weakest currencies as NA traders enter.
In other markets:
- Spot gold is trading at $1254.84, +$0.93 or 0.07%
- WTI crude oil is at $44.74, up $0.28 or +0.61%
- US yields are lower. 2 year 1.311%, -4 bp. 5 year 1.74%, -2.3 bp. 10 year 2.151%, -1.2 bp. 30 year 2.737%, -1.3 bp
- US stocks are ending mixed. S&P is up 0.69 points or +0.03%. Nasdaq down -13.743 points or -0.22%. Dow is up 24.38 points or +0.11%
The US session got off on the wrong foot with weaker housing data. Housing starts and building permit were both weaker than expectations. The dollar moved lower on the news. Although the USDJPY is ending the day, little changed, it moved down from being up about 0.41% at the start of the NY session.
Around 9 AM, an announcement that Amazon was purchasing Whole Foods for $42 per share, sent the stock markets into a "sell the losers" and "buy the winners" (although it was more of a sell the losers) mode. It certainly dominated the business news for the rest of the day and perhaps helped to weaken the dollar with the story being that Amazon undercuts prices. That means lower inflation.
The dollar continued to weaken and 10 AM data like the labor market conditions index (2.3 vs 3.0) and the Univ of Michigan consumer confidence (94.5 vs 97.1 estimate) did not do much to slow the dollars decline.
For the day, the green back was the weakest of the major currency pairs. It fell the most vs the commodity currencies like the NZD (-0.65) and AUD (-0.58%), but also fell against the EUR (-0.49%).
Technically,
The EURUSD is ending the week little changed from last week (like at the same level). The high could not get above the 1.13000 high from the November election. The low stalled at the broken 61.8.% of the move down from the May 2016 high (at 1.1128). The price is closing above the 1.1161-71 level which is my risk level for longs in the new trading week (CLICK here for the EURUSD technical review).
The USDJPY stalled after a 2 day, 260 pip rally that took the price from 108.788 to 111.41. The weaker data today, helped to take some of the wind out of the sales. For the week the pair did end up higher (closed at 110.28 last Friday and is trading at 111.84 currently). The move higher did take the price above its 200 day MA at 110.589. That is close risk for longs in trading in the new week. The low today stalled just above that MA at 110.63. A move back below that level will turn the bias more to the bearish side. Until then the bulls are more in control. On the topside, a break of 111.58 (50% of the move down from the May 2017 high) should be more bullish and lead to a push toward the 100 day MA at 111.867.
The GBPUSD closed last week at 1.27368 and moved lower on Monday to test the post UK election day lows at 1.2634. When the price could nor breach that level (the low reached 1.2638), a move back higher started. The peak reached 1.2818 on Wednesday, but understand the price action was not exactly a straight line (or even followed a modestly sloped trend). There were lots of ups and downs this week, and that was congruent with the technical and fundamental stories. Rather than repeat the story, click on the link here for the story this weekend. It will tell what to look for in the new trading week.
The USDCAD corrected higher on Thursday after bottoming on Wednesday. That correction took the price to the 38.2% of the move down from the June 9th high (that was last Friday) at 1.33059 and also the 100 hour MA just a few pips higher at 1.3310. The high on Thursday reached 1.33077 - splitting the difference between the two levels. Today, the price wandered lower, and in the process, kept below that 100 hour MA (see post here showing the tech picture). There was a test of the key MA in the NY session, but sellers kept the lid on it. The price is ending the day down near the lows at 1.3208. PS if the commitment of traders report is the proxy for speculative positions in the market, those traders are short the CAD and wrong (i.e losing money). That could help keep the pressure on the USDCAD pair in the new trading week as longs are faced to cover. The 1.3150 and 1.3126 are the next stops on the bearish train.
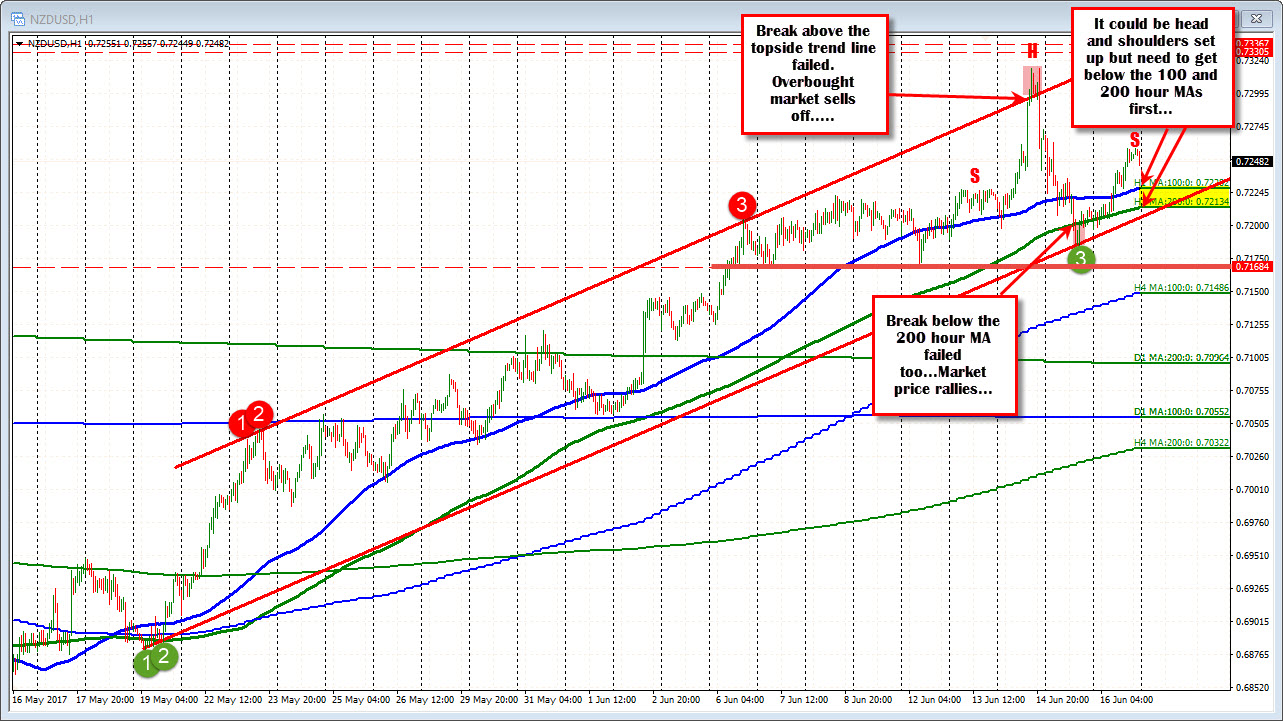
Honestly, I did not write a lot about the NZDUSD this week, but below is the technical picture that interests me. At the highs this week, the price extended above a topside channel trend line and failed. That was a classic overbought sell after a trend move higher (you don't need an oscillator to tell you overbought by the way). The fall on Thursday, took the price below the 200 hour MA for the 1st time since May 22nd. The price should have gone lower, it did not. So there were two failures. If you blur your eyes, I can see a head and shoulders formation. That could disappear in an instant if the trend continues higher. So what I would like to see next week, is a move back below the 100 and 200 hour MAs (blue and green lines in the chart below) at 0.7228 and 0.7213 (and stay below). That would give me (traders) more confidence in the downside. How far it goes depends on if it can then get below the 0.7168 (see thick red line) and 0.7146 (100 bar MA on the 4-hour chart) levels. That would open a move toward the 100 day MA at 0.7100 area. All is dependent on getting below the two MAs though.....
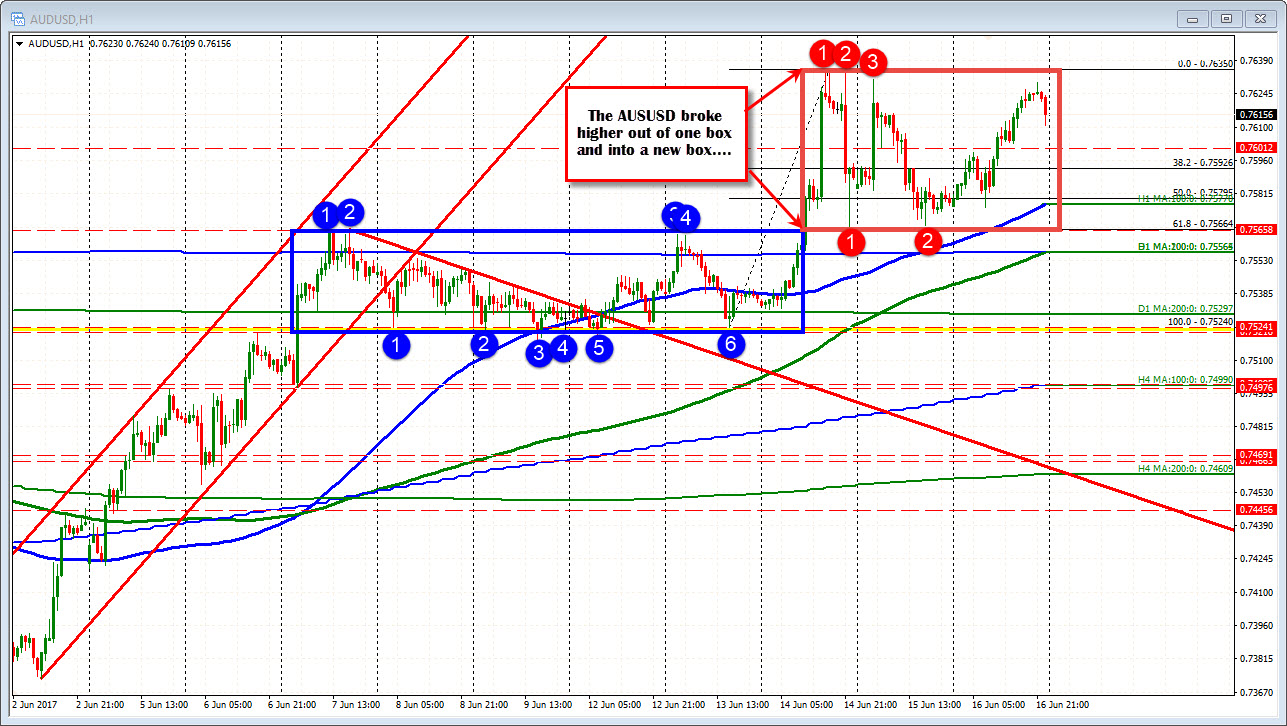
The AUDUSD is about boxes. The pair was trading within a defined "blue box" from 0.7520 to 0.7566 from June 7th to June 14th (Wednesday). On Wednesday, that blue box was broken, and the price rallied to a high of 0.7635. Three highs were made and the price rotated lower. Where did it stop? At the bottom of the new red box (see chart below) at 0.7566. In the new week, the question will be, "Do we break out of the red box?" and "Which way?" We are closing near the high, which favors the bulls to keep the move going, but the tide can turn around if the box can't be broken (click here for the box talk this week).
It is Father's Day this weekend. Wishing my Dad a great day. And to all you fathers out there, have a good and peaceful day and thank you for your support. Greg.

