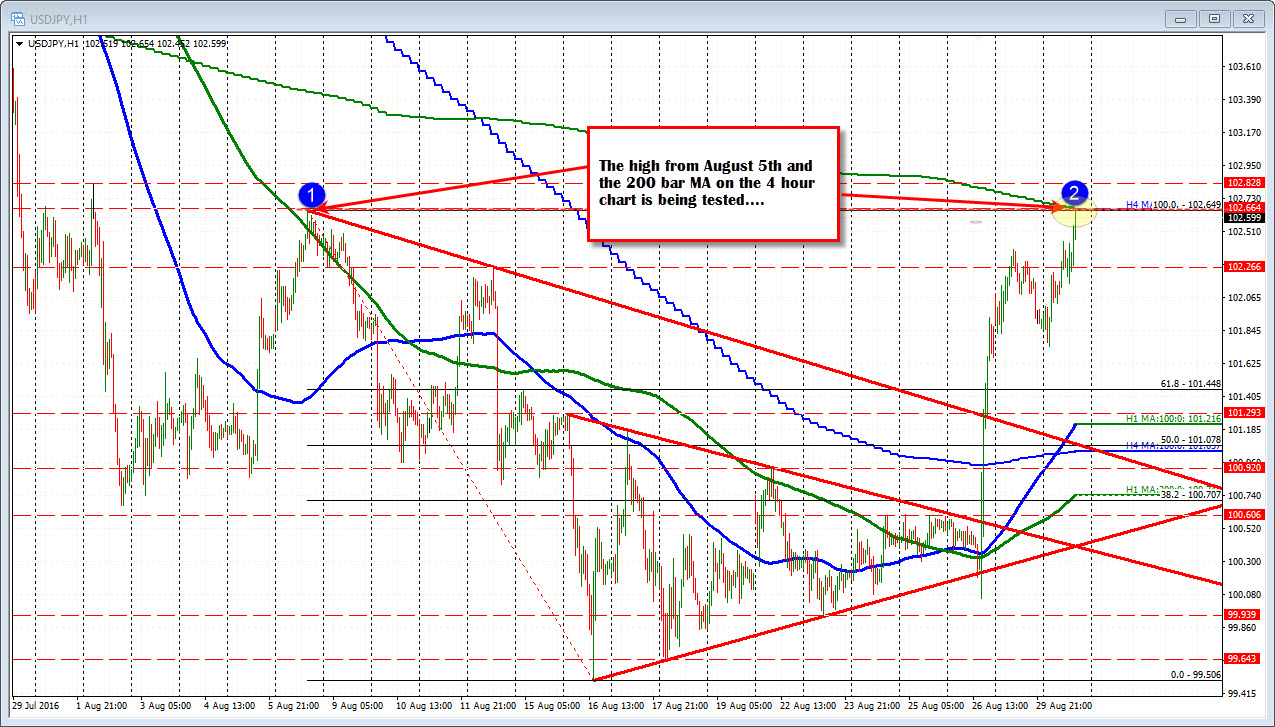
100 bar MA on the 4-hour chart and the high from August 8th
The USDJPY is testing a key level at the 102.649 area. The 200 bar MA on the 4-hour chart is at that level and the high from August 5th is also right at that level. A break above will target the 102.828 (the high for August) but on the first look expect sellers as risk can be defined and limited against the dual resistance target.
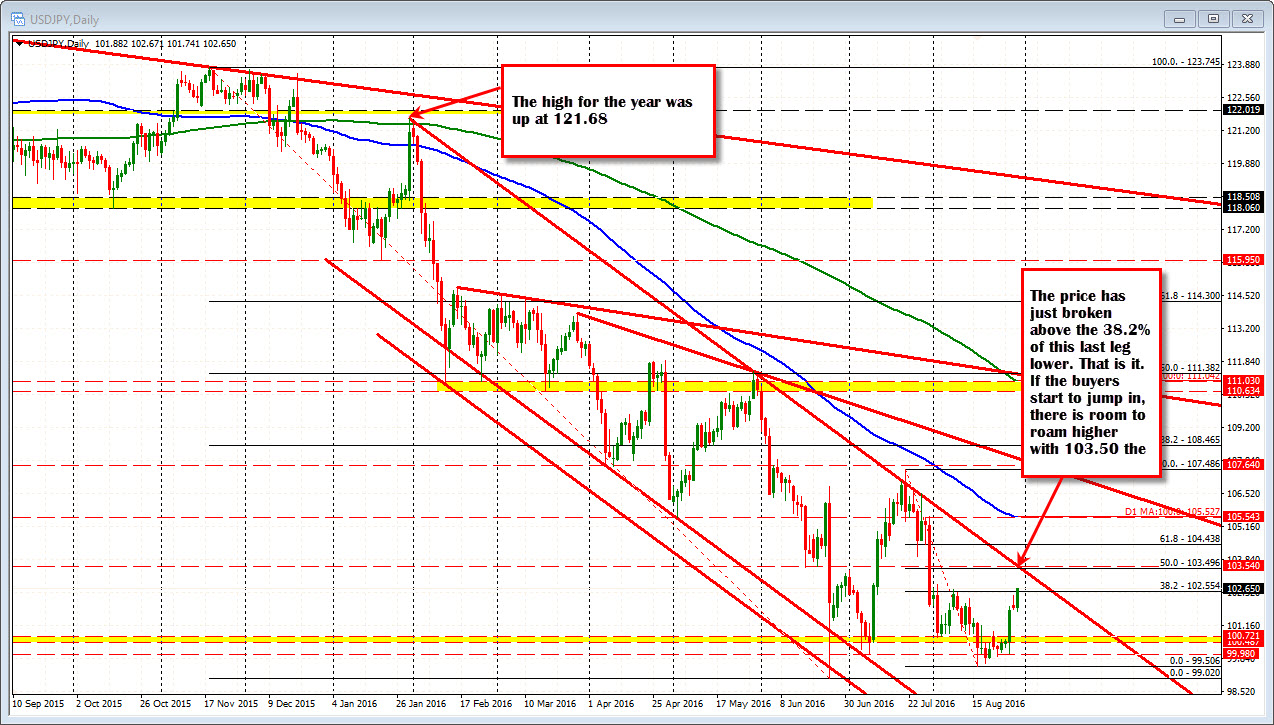
Although the dual resistance area should solicit some intraday selling on the test (traders will play the risk odds with the low risk trade), looking at the daily chart, the pair does have room to roam. The pair is just getting above the 38.2% of the move down from the July high at 107.486. The 50% at 103.50 is the next target on a move higher. Above that the 100 day MA at the 105.527 is another key target level for the pair. The price of the USDJPY has not traded above the 100 day MA since early February. To give you an idea (and putting things into perspective), the price was trading at the 105.52 level just a month ago. It is an easy target on more buying.
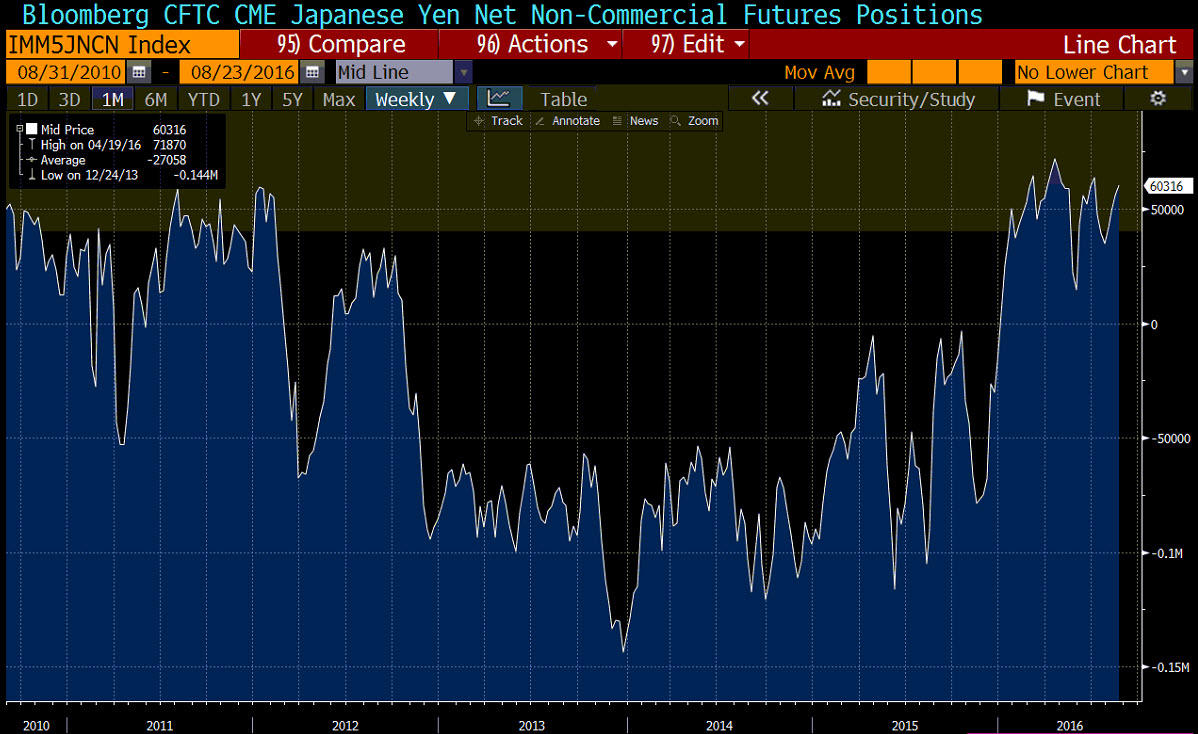
PS the commitment of traders shows that JPY positions are net long and the longs remain near high levels. That too supports a potential squeeze of the speculative longs.
Fundamentally, the Fed officials are once again are threatening to tighten (they may be spoofing the market a bit), and BOJ Kuroda took advantage by also talking about doing all he could. The BOJ is likely not happy with the USDJPY at the low 100's . The high for the year was 121.68. That is near a 20% worsening of terms of trade. So resistance yes, for a trade, but there is room to roam on a break higher.