High from 2007 at 124.13. Price high stalls just below after GDP
The US GDP...well it is a ways back there in the rear view mirror, but it was better at -0.7% vs -0.9% (if that is good news). We all know as well, that the numbers will be fudged because the seasonal adjustments need to be reseasoned (might as well just put GDP at 3% for all quarters and call it a day). Anyway it was from 1Q no matter how it is seasoned. That ended March 31. It is now month end May. So it is back there.
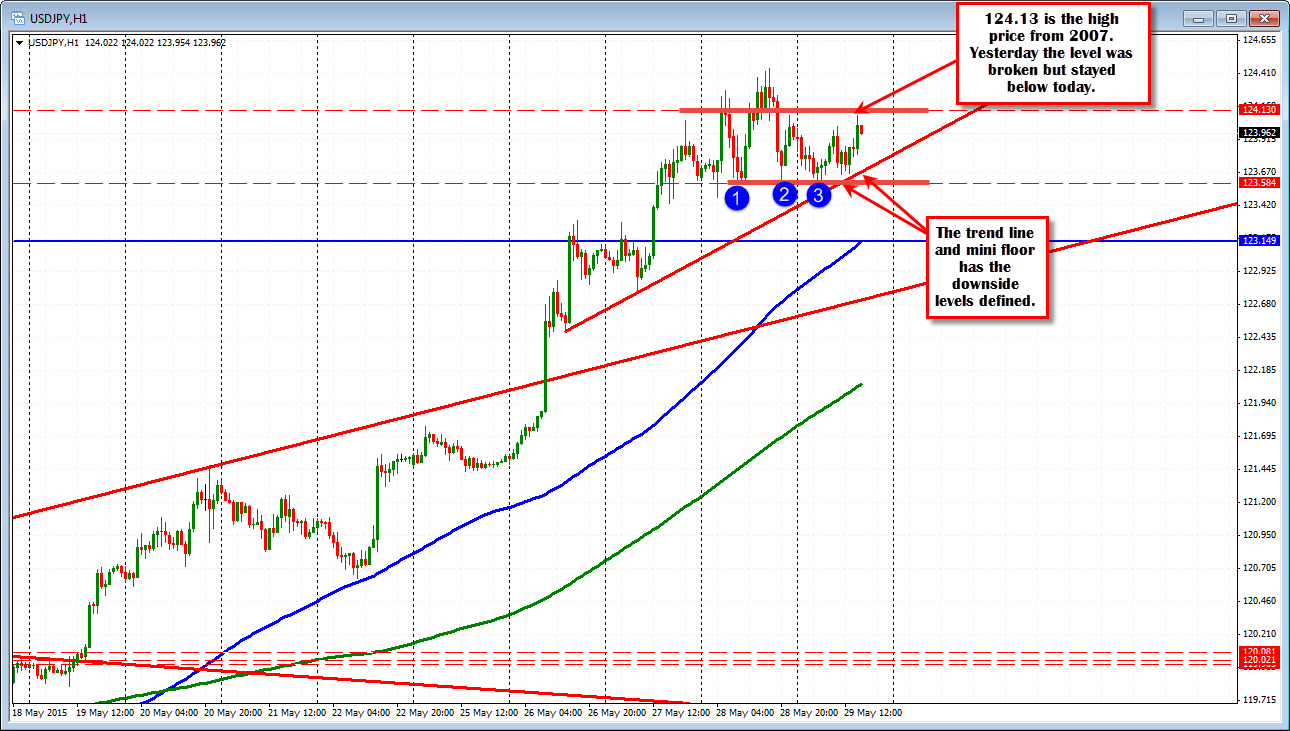
Nevertheless, the USDJPY moved higher but was able to stay below the 124.13 level. This level is the high price from June 2007. Yesterday, the price moved above this level and it allowed the headlines to read that the "USDJPY trades at the highest level since 2002". Now with the new high from yesterday at 124.45 there is more to go before headlines can spew that again. Nevertheless, the market is likely to use that level (124.13) as a target (or so I would expect).
Looking at the hourly chart, the trend line support comes in at the 123.67. There is a mini floor not far from that level at 123.58. This area is downside support. The range today is a small 50 pips vs 80 pip month average. So there is room to roam on a break in either direction.
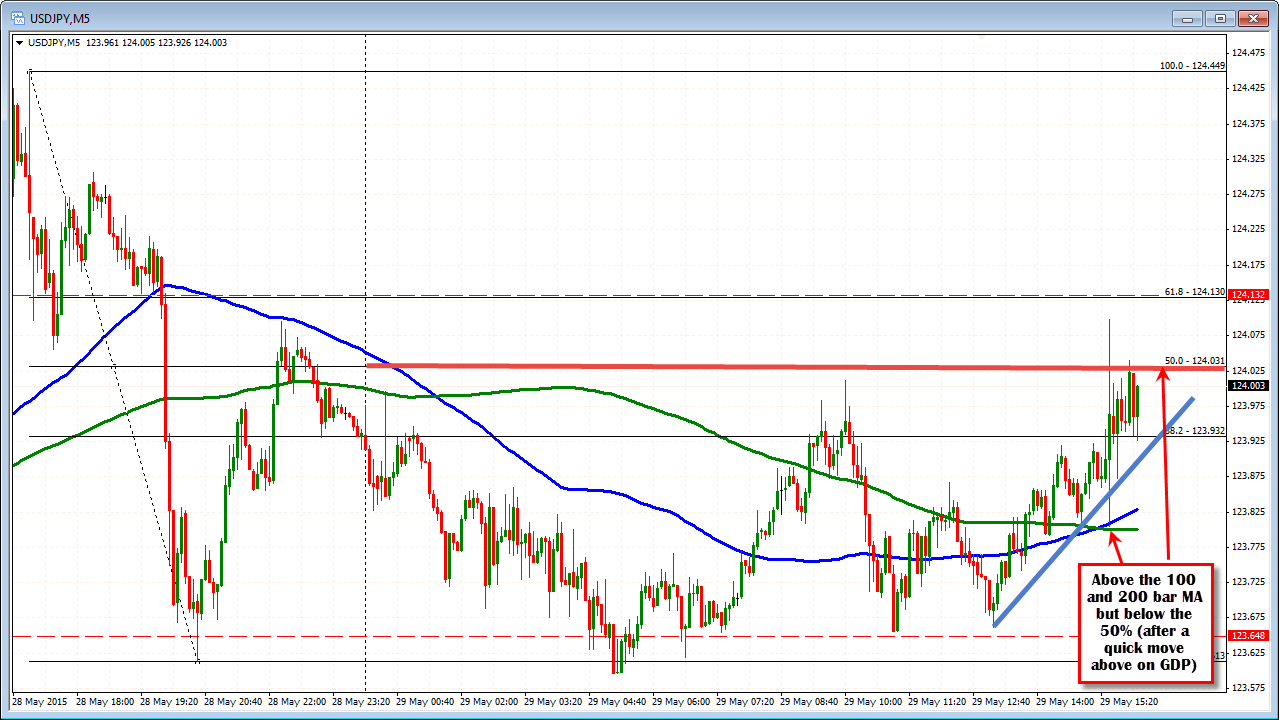
Any clues from the 5 minute chart? Mixed too. The price held the 100 and 200 bar MA below. It is higher on the day. But the 50% retracement is so far holding resistance (sans the quick move higher after GDP). A move above 124.03 and then 124.13 is eyed by bulls for more confidence. A move below the 100 and 200 bar moving average on the 5 minute chart at the 123.80 area will be eyed by the bears. Overall, with the price chart showing big gains this week, the burden is still on the sellers to prove they can push the price lower. So bulls more in control.