
Safe haven flows take break before US stock opening
The USDJPY tumbled to a low of 118.69 in trading today - the lowest level since October 15. The move lower moved below the 50% and 61.8% of the move up from the August low to the November high at 119.918 and 119.014.
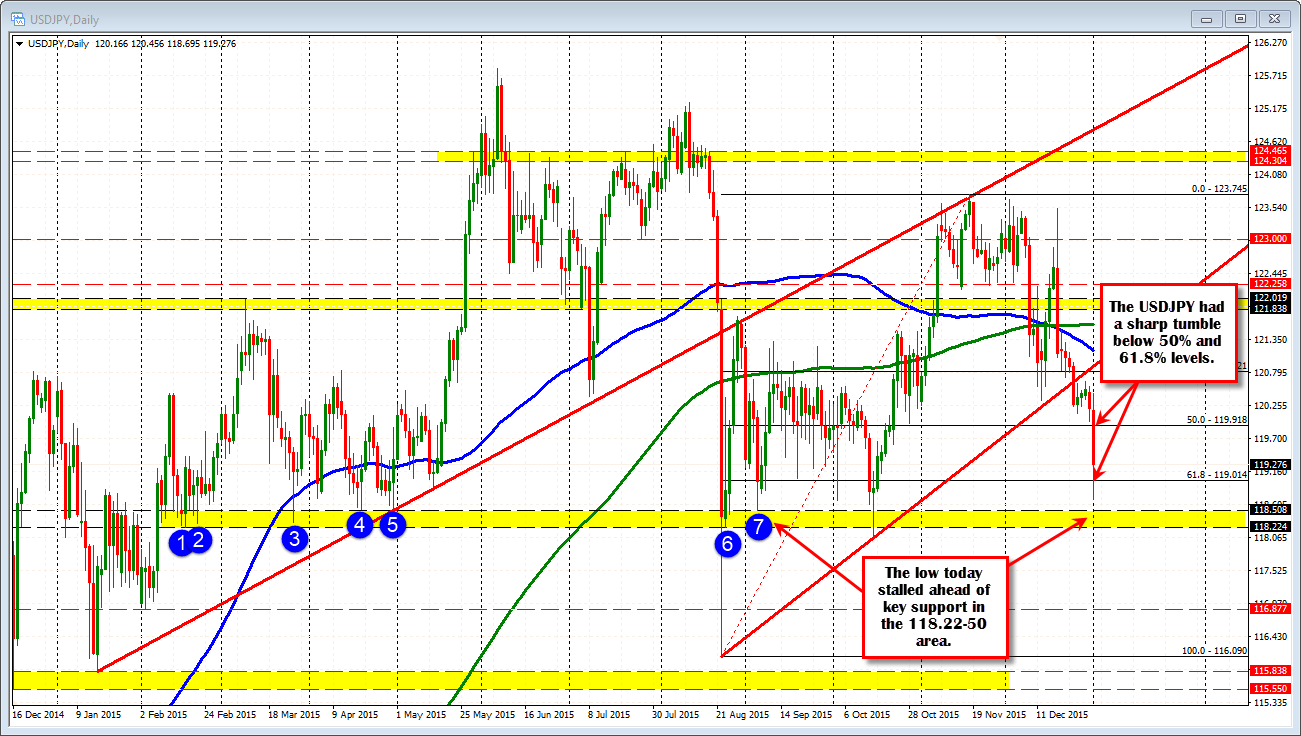
The low stalled before what I see as a key support at the 118.22-51. This area had a number of swing lows going back to February 2015 (see blue circles in the chart below). On a continuation of the move lower today, look for buyers to take profit in this area, with stops on a break below.
The correction higher has pushed above trend line resistance and now above the 100 bar MA on the 5-minute chart (blue line in the chart below). Traders looking to sell a correction into the US stock opening will look at the 119.54-57 as a level to eye. This area is defined by the 200 bar MA on the 5 minute chart. It is also the 50% of the days move lower. I would expect patient sellers to lean against the level on a test (risk defining level). For more aggressive sellers, the 38.2% is near-ish the midpoint between the 100 and 200 bar MA.
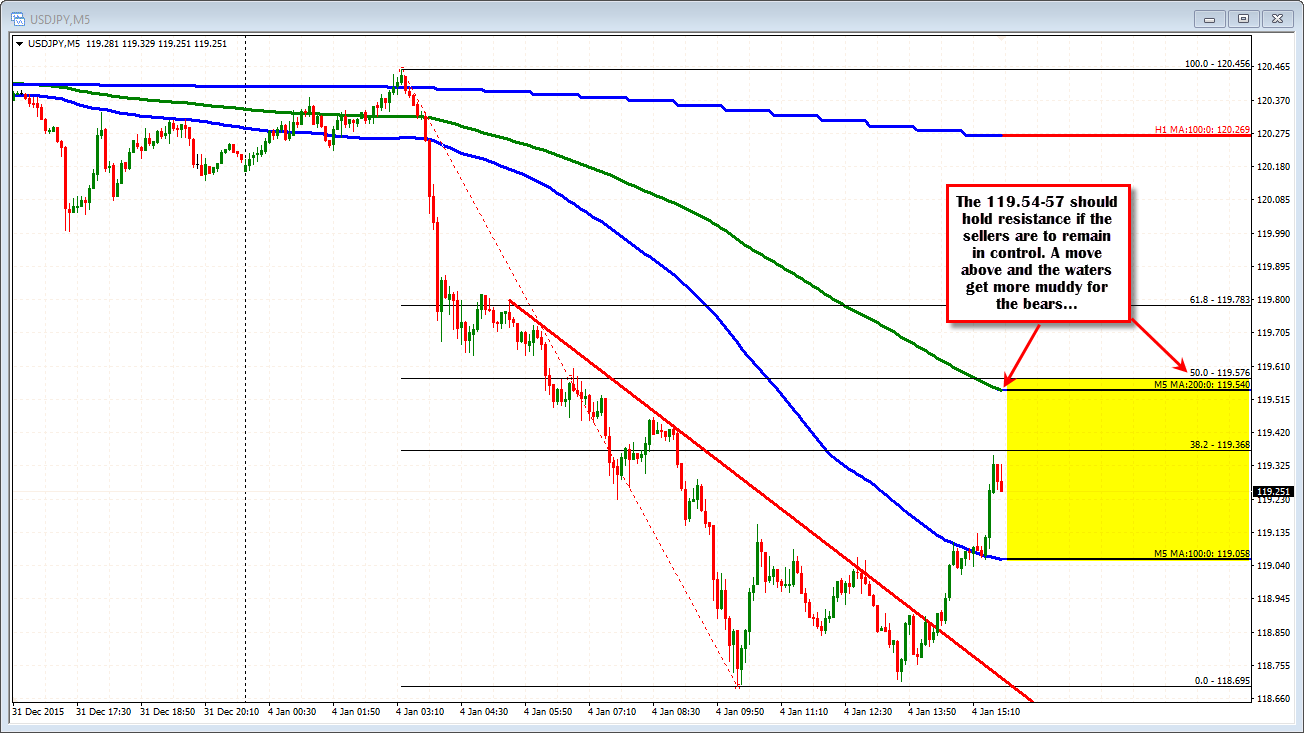
Overall, the sellers remain in control, but in the midst of the first technical correction for the pair.

