Manufacturing data a disappointment
The US Industrial Production and Capacity utilization data was not nice. The PPI data earlier was better than expected. The dollar seems to be influenced by positioning ahead of the FOMC and anxiety from EU referendum vote in the UK next week. Get used to it. It is not going away and it will influence the flows.
The environment we face requires pulling back and picking patient spots.
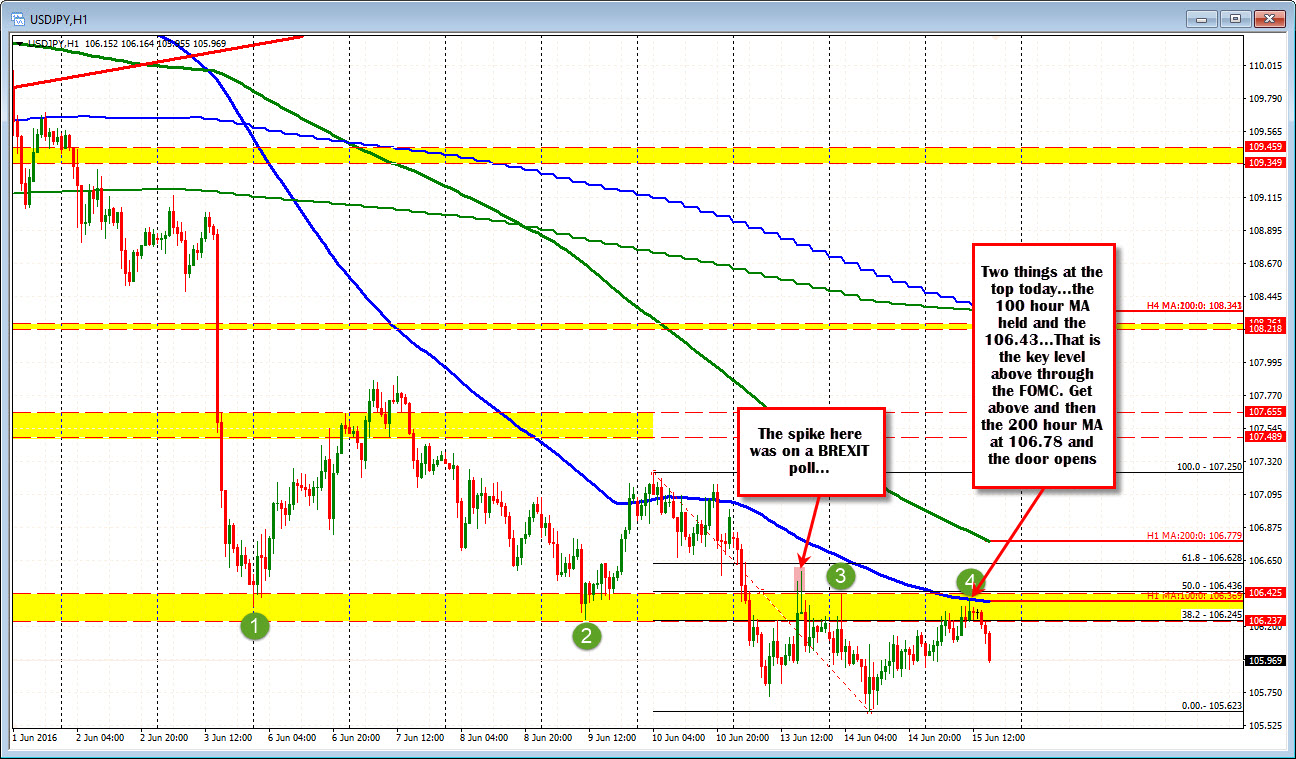
For the USDJPY, that spot today came against the 100 hour MA (blue line in the chart above). The price for the pair slowly approached that level at 106.39. The high? 1.0639. Traders leaned against the level and put a lid on it. Last Friday, was the last time the price pushed the 100 hour MA during the correction. It was the first looks above the MA level, but failed by the NY PM trading.
The price fall on Monday and into Tuesday moved below an area of technical interest between 106.24 and 106.425. There have been a number of swing lows/highs against that area. On Monday, I outlined the level in the this post. The high yesterday stalled at the 106.42 level and moved down to 105.623. So the resistance held. The traders leaned.
Today, the high not only stayed below the 100 hour MA but also that "line in the sand" outlined Monday.
We are currently printing NY session lows and working on getting to the low for the day at 105.92. The action today, increases the technical resolve at that level above. That is, the question into the FOMC remains the same as the post title from Monday.... "Can the USDJPY remain below the _____________?". The blank is 106.245 to 106.43. If it can, the sellers remain in control and the buyers are not.
The problem is the FOMC gets in the way but at least risk is defined. Also traders who sold earlier against the key levels, have some pips in their pocket to book or as a cushion through the decision. The choice is yours. If the price moves back above the 106.43, I go back to my comment on Monday "the gig is up" for the shorts.
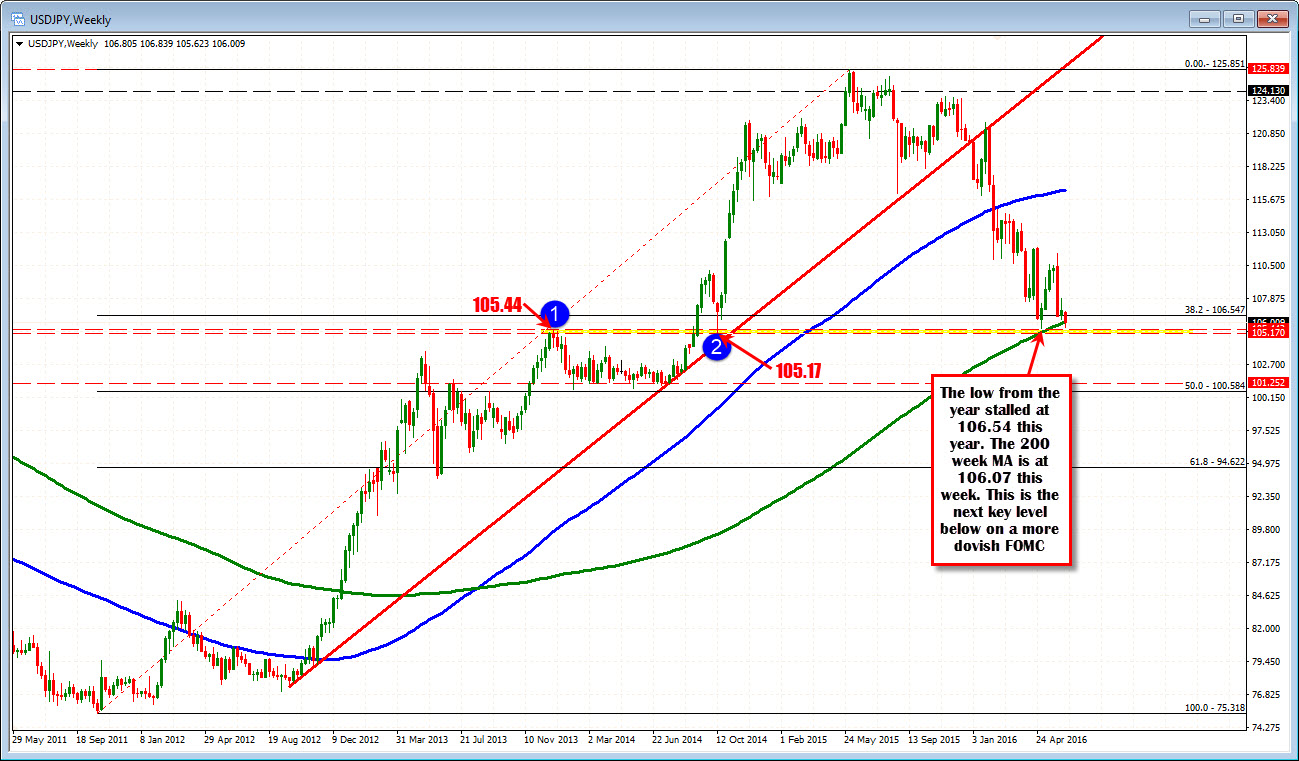
If it stays below, the low from yesterday at 105.62 and then the low for the year at 105.54 will be eyed. Break those levels and the swing high from December 2013 at 105.44 and the swing low from October 2014 at 105.17 will be eyed (see weekly chart below). If the 106.24-43 are key above, that area is just as key below.
PS Between those two extremes? The 200 week MA is at 106.07...Just saying. The lines of sand are drawn. Which way will the market turn? Right now, the sellers have shown a willingness to sell against resistance. Yesterday, the price held the low for the year. It can go either way. Will the Fed give a clear signal? Will the market push the price outside the extremes (and stay outside). We of course won't know until we know, but we can prepare, know the levels and if we get a shot (like the seller against the resistance today), take a low risk trade. But should you chase it? No. Patience. Also, if the risk is too great for you (you are justified), be happy to take your profit (or at least some of it) and relieve some/all of the pressure. There will always be another trade. There will be less risky times to trade too.