
Getting a boost from equity optimism
The USDJPY is trading above the 100 hour moving average (blue line in the chart below), which currently comes in at 117.849. The price moved above this moving average on Friday, but only for a brief moment after the better-than-expected US employment report. This is the 2nd look above and moving average in the New Year. More bullish.
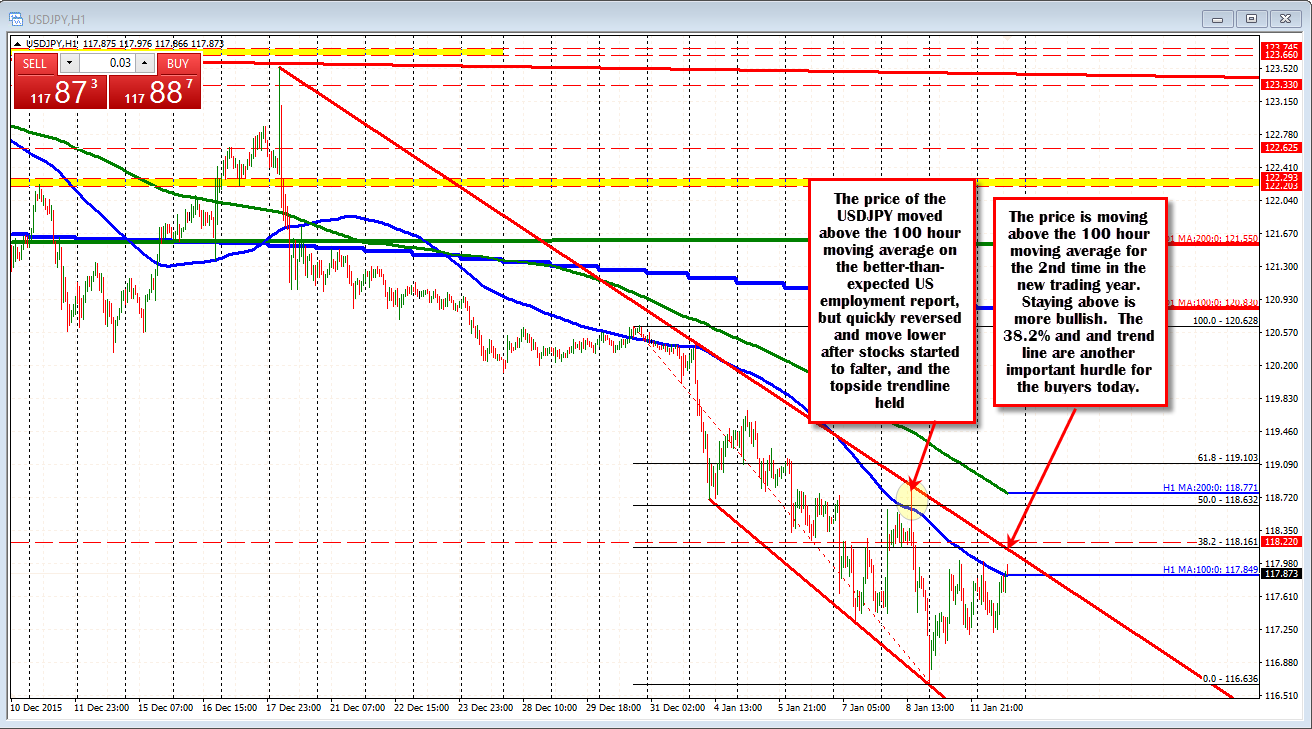
Trendline resistance comes in at 118.16. This also corresponds with the 38.2% retracement of the move down from the December 30 high to the low reached yesterday morning. The 50% retracement at 118.632 and the 200 hour moving average (green line in the chart above, at 118.772 are other upside targets should the bullish bias continue in trading today. It will likely take a strong stock market, but regardless we know that the 100 hour moving average should be a key barometer for bullish and bearish bias. The market is testing the bears at the moment. Will they keep that bias alive? Watch 117.75. That was the close from yesterday. It might be a close risk for the buyers too.

