Falls below the 100 hour MA
The USDJPY has moved below the 100 hour MA and the underside of the broken trend line at the 119.45 level (see blue line in the chart below). The US stock market is off to a negative start with the S&P down -11. and the NASDAQ down -27 points after breaking and closing above the 5000 level for the 1st time in nearly 15 years. That is weighing on the pair.
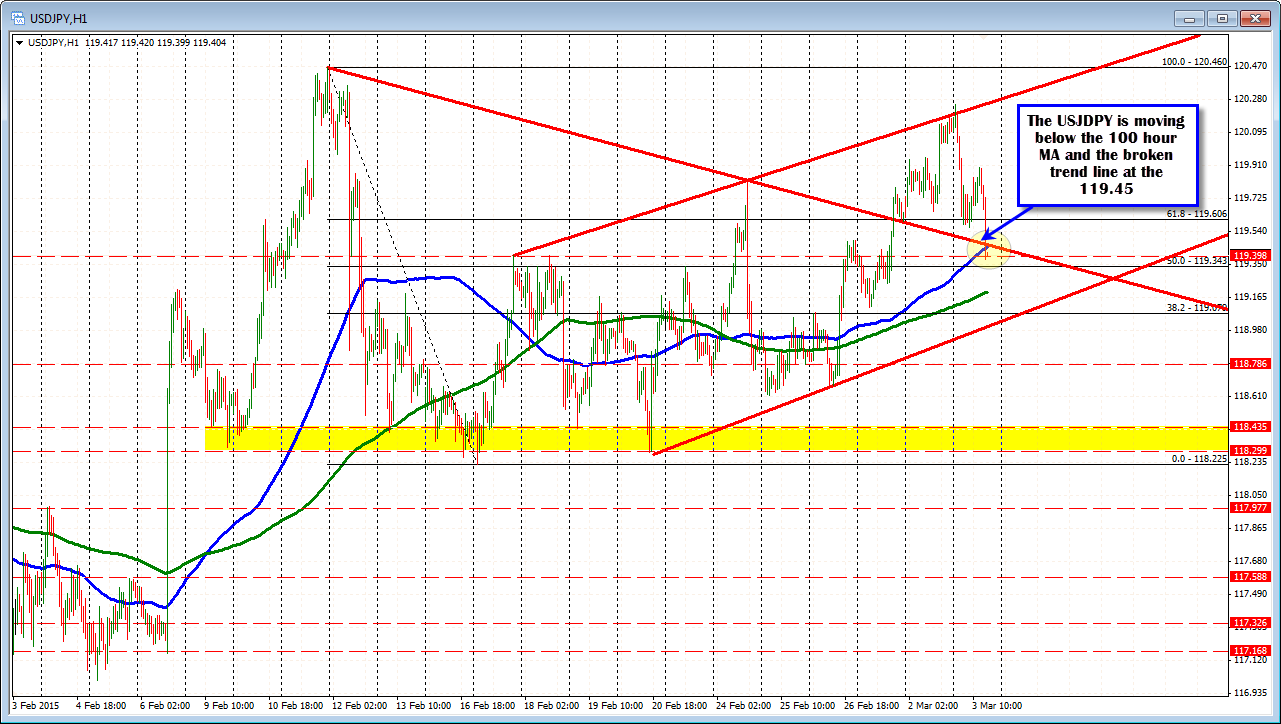
At the highs today the pair tested topside trend line before falling back lower. The 50% of the range since Feb 12 comes in at 119.34. The 200 hour MA comes in at 119.19 currently (green line in the chart above).
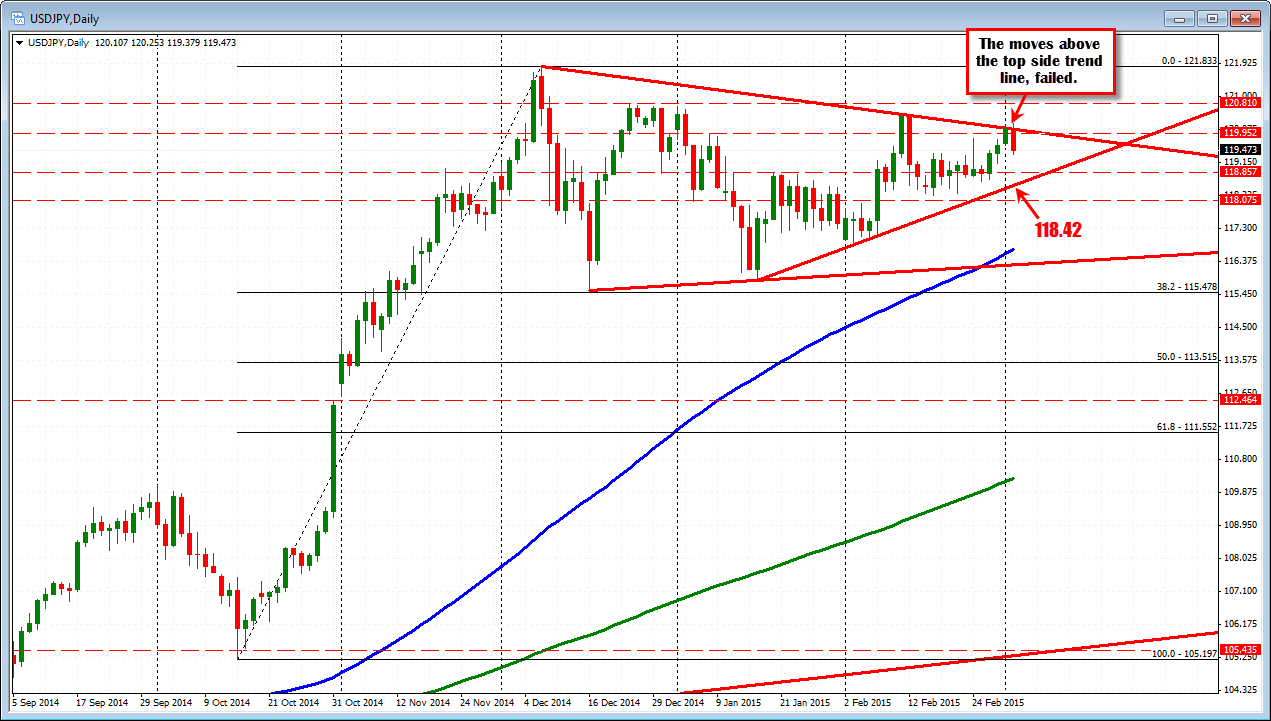
Looking at the daily chart, the pair moved above topside trend line both yesterday and today. However, the momentum has faded. The lower trend line currently comes in at 118.429. That level might be the logical target should the bears remain in control.
The overall bullish bias remains for this pair. Japan continues to have more challenging economic hurdles. The US is on the way to tightening at some point in 2015.
However, should the US stock market retrace after the push to Nasdaq 5000, there could be that ubiquitous "flight into the relative safety of the JPY" trade. Weaker employment might also be a catalyst. The ISM manufacturing data yesterday showed the employment component move lower last month. Despite the surge in the NY current business conditions index today, the employment component declined from 55.4 to 49.3. ADP comes out tomorrow at 8:15 AM ET. The market will start to focus more and more on the employment report as the day approaches. It is easier to think the NFP number might be less than expectations (weather, ISM data weaker, Initial Claims above and below 300 K in the current month) versus greater than expectations.
Will the market start to think that way before the event? What do you think?