All came crashing down.
It wasn't too long ago (Friday), the USDJPY soared on the surprise BOJ decision. Since then, the correction turned to a fast break the other way today. That's trading.
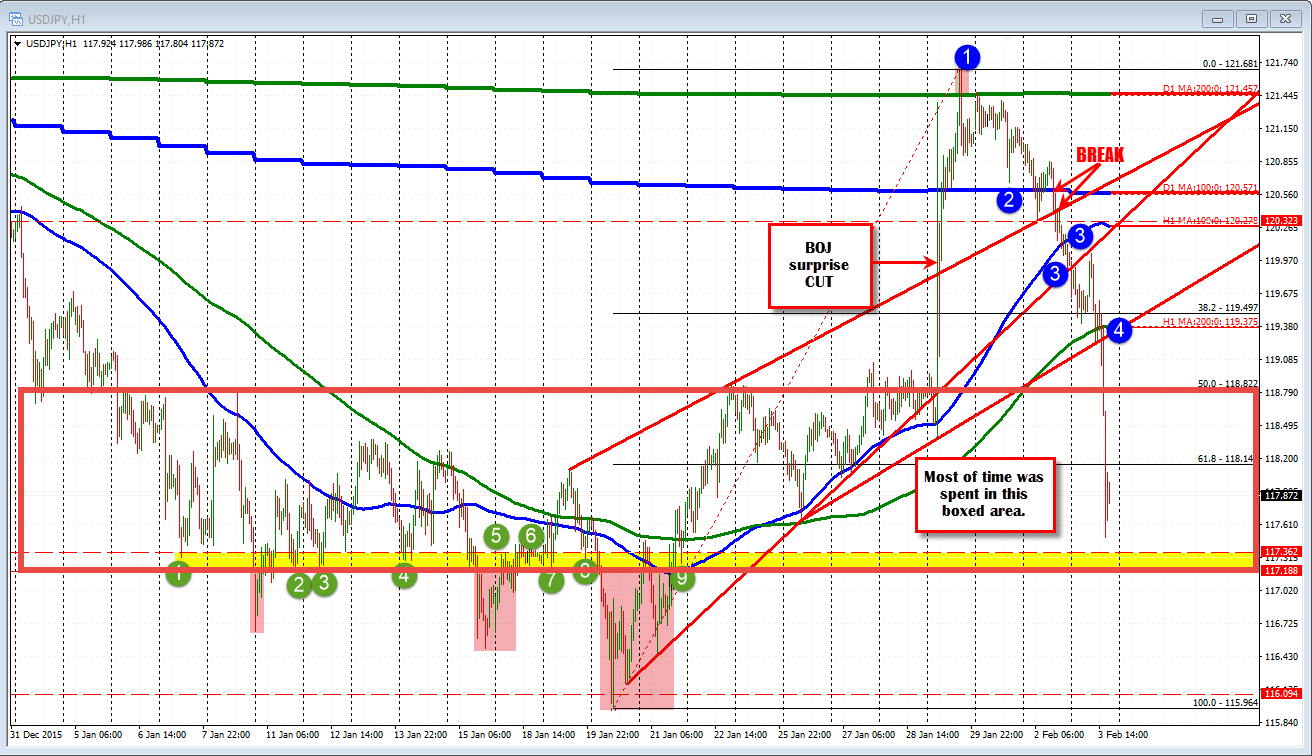
Looking at the hourly chart, the bearish ball got rolling on the:
- Failure of the move above the 200 day moving average on Friday at the 121.45 area.
- On Monday, the price tested the 100 day MA at 120.58.
- Yesterday, the price fell below a broken trend line and the 100 hour MA.
- Today a lower trend line and 200 hour MA were broken and the price ran and ran and ran to a low at 117.49.
ON the hourly chart there are some lows and highs in the 117.18-36 level Yes, there were moves below that area in January. So the price can break and run, but that area did slow some declines in January.
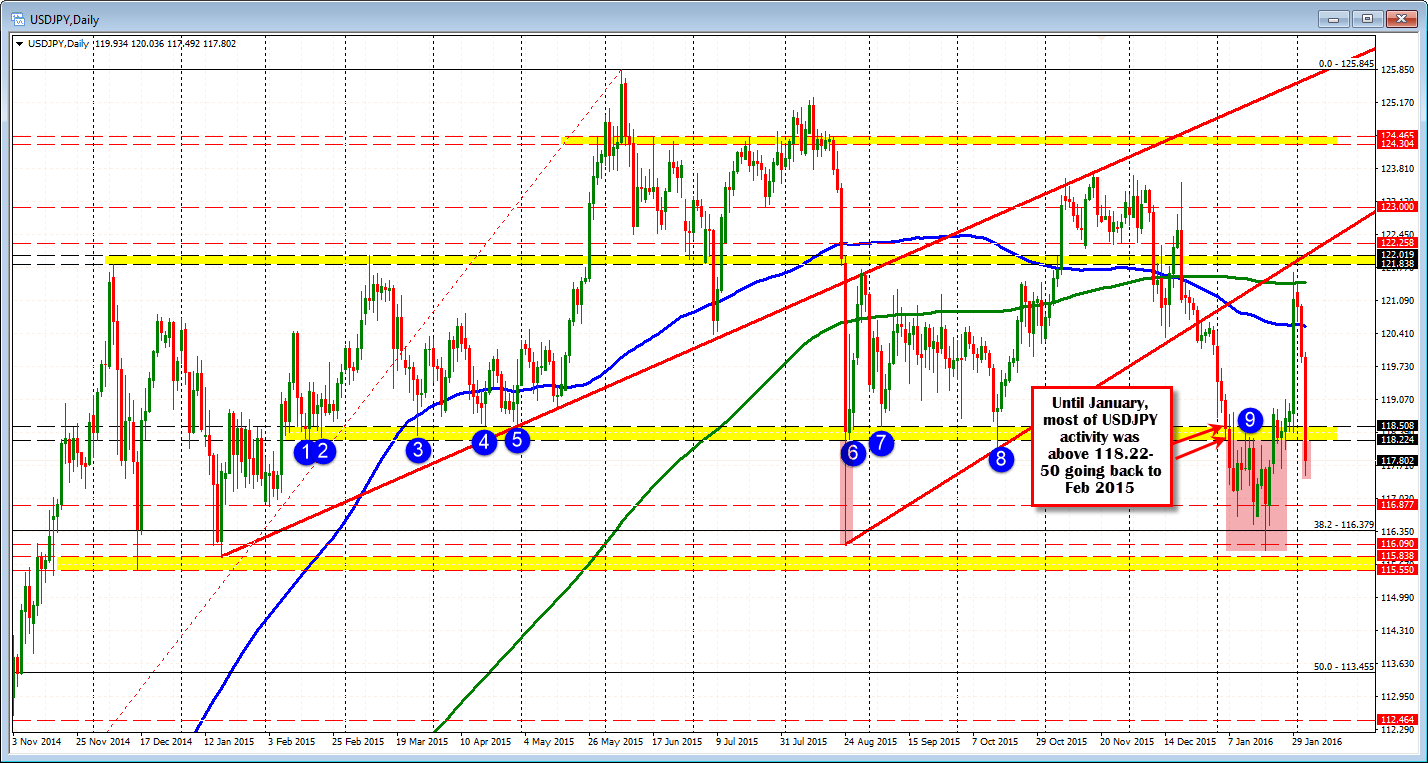
Looking further back on the daily chart, the move lower today was able to get below an area of support going back to January 2015. That area comes in at 118.22-50 (see chart below). January saw the price mostly trade below this area (and move above and below it at times as it chopped around). Traders may look at this area as topside resistance now that it is broken.