
Pushes above cluster of technical level. Can the push hold?
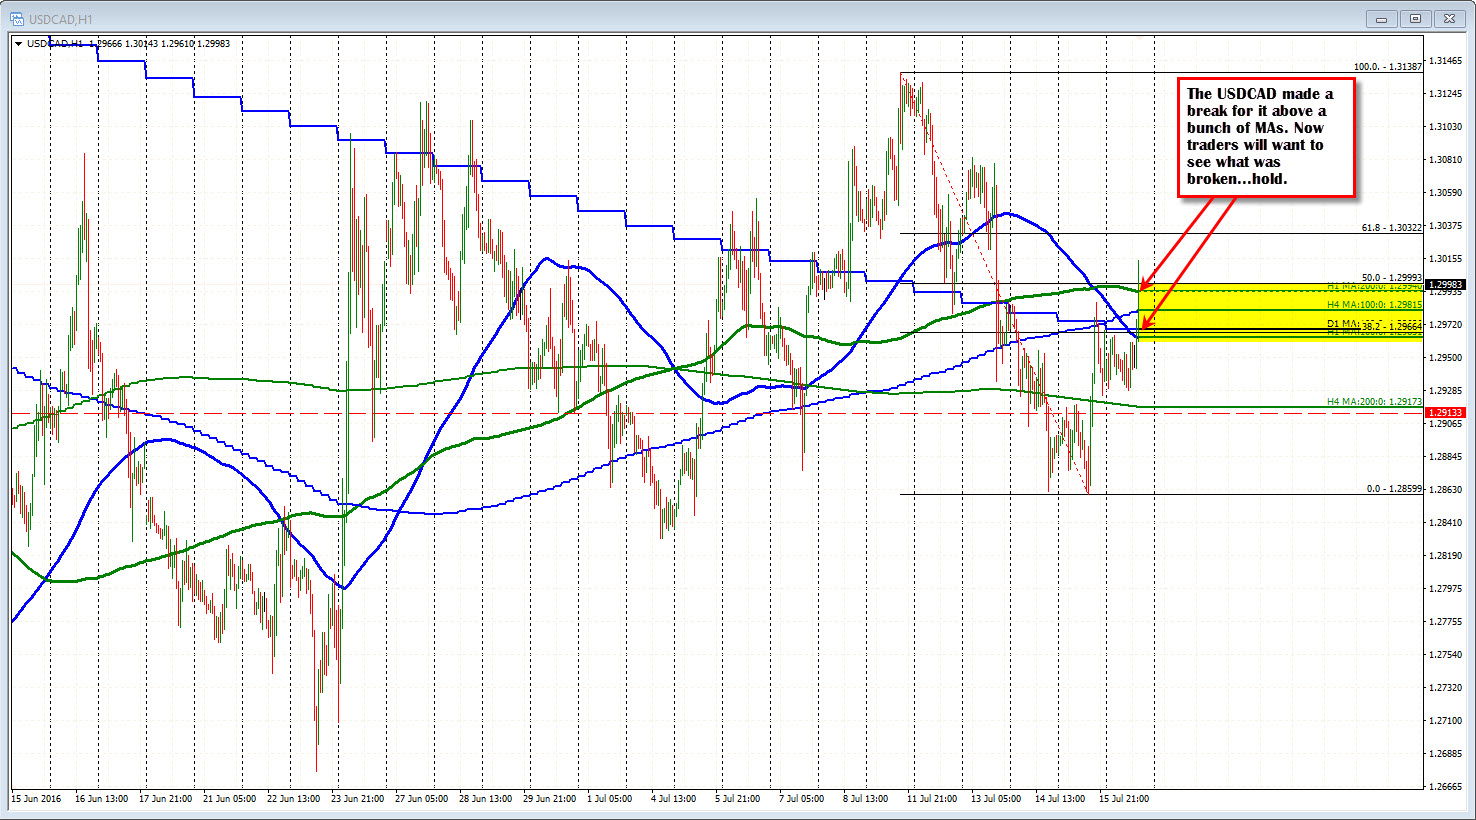
The USDCAD made a break for it. Moving above the 100 hour MA at 1.2964 (blue smooth line in the chart below), the 100 day MA at 1.29697, the 100 bar MA on the 4-hour chart at 1.29816, the 200 hour MA at the 1.2994 level (green line in the chart below) and the 50% of the move down from July high at 1.2999.
This pair has had it's share of ups and downs. There is that element of distrust.
So traders will be watching the levels just broken to provide bias clues (and support). I would think that if the price can find support buyers near the 200 hour MA at 1.2993, the market bulls will be appeased. A move below - that looks like it will stay below - and they make get angry and exit.
Such is the life in an up and down market. Trading at 1.2998 now. Looking to hold support.

