
Slides toward lows from last week.
The USDCAD has slid further to the downside. Crude oil is up 1.63% on the day and helping to contribute to the stronger CAD.
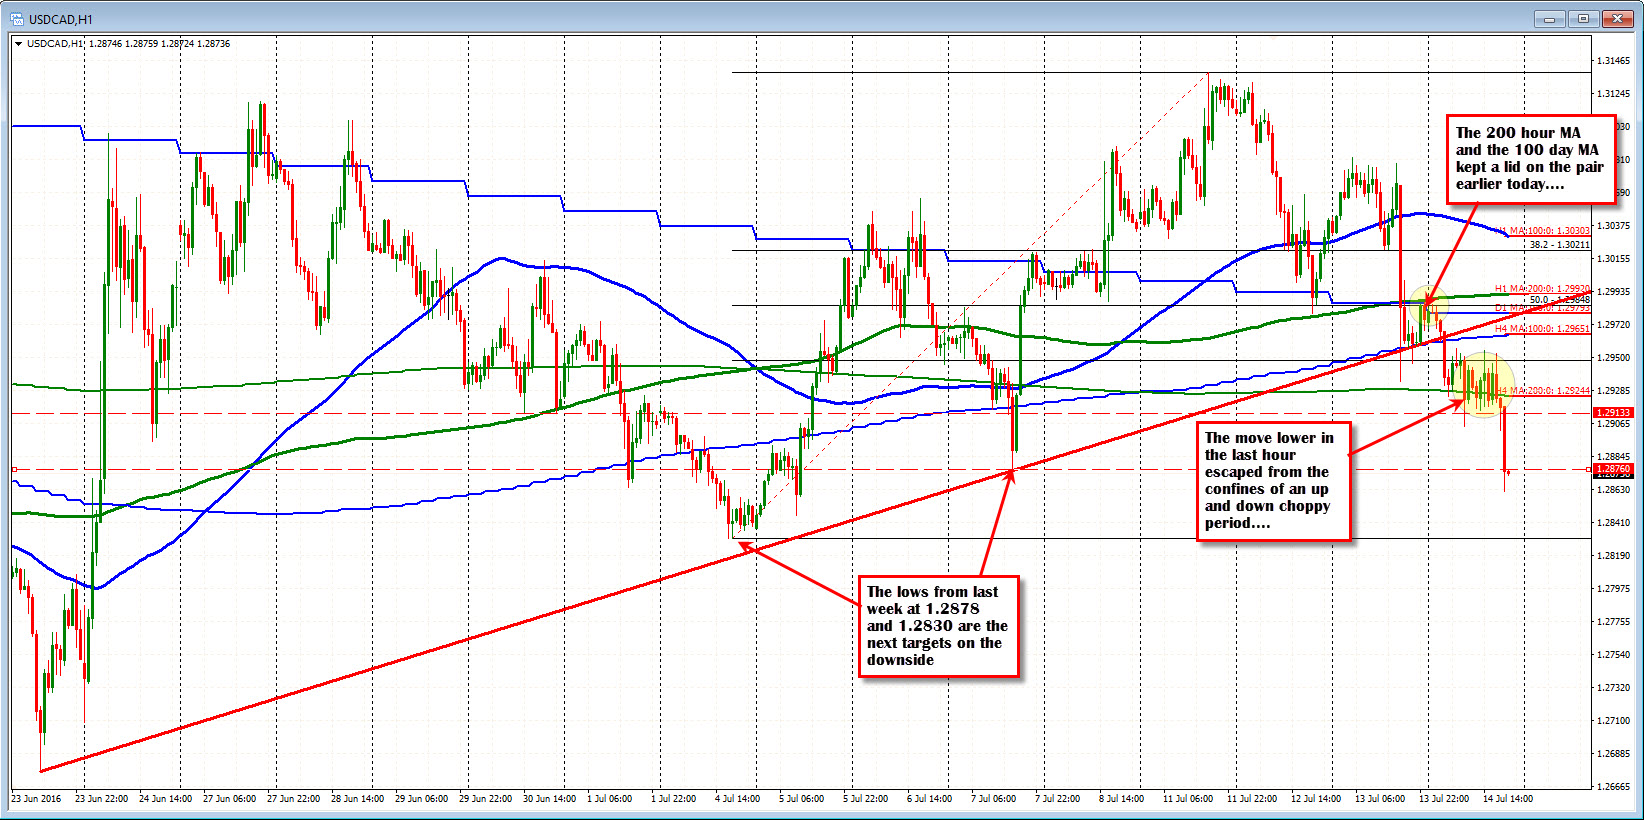
Technically, the pair was able to keep a lid on the pair against the 100 day MA at the 1.29793 level today. The high price was 1.2985 in the early Asian Pacific session. Until the recent push lower, the price spent most of the NA session chopping up and down.
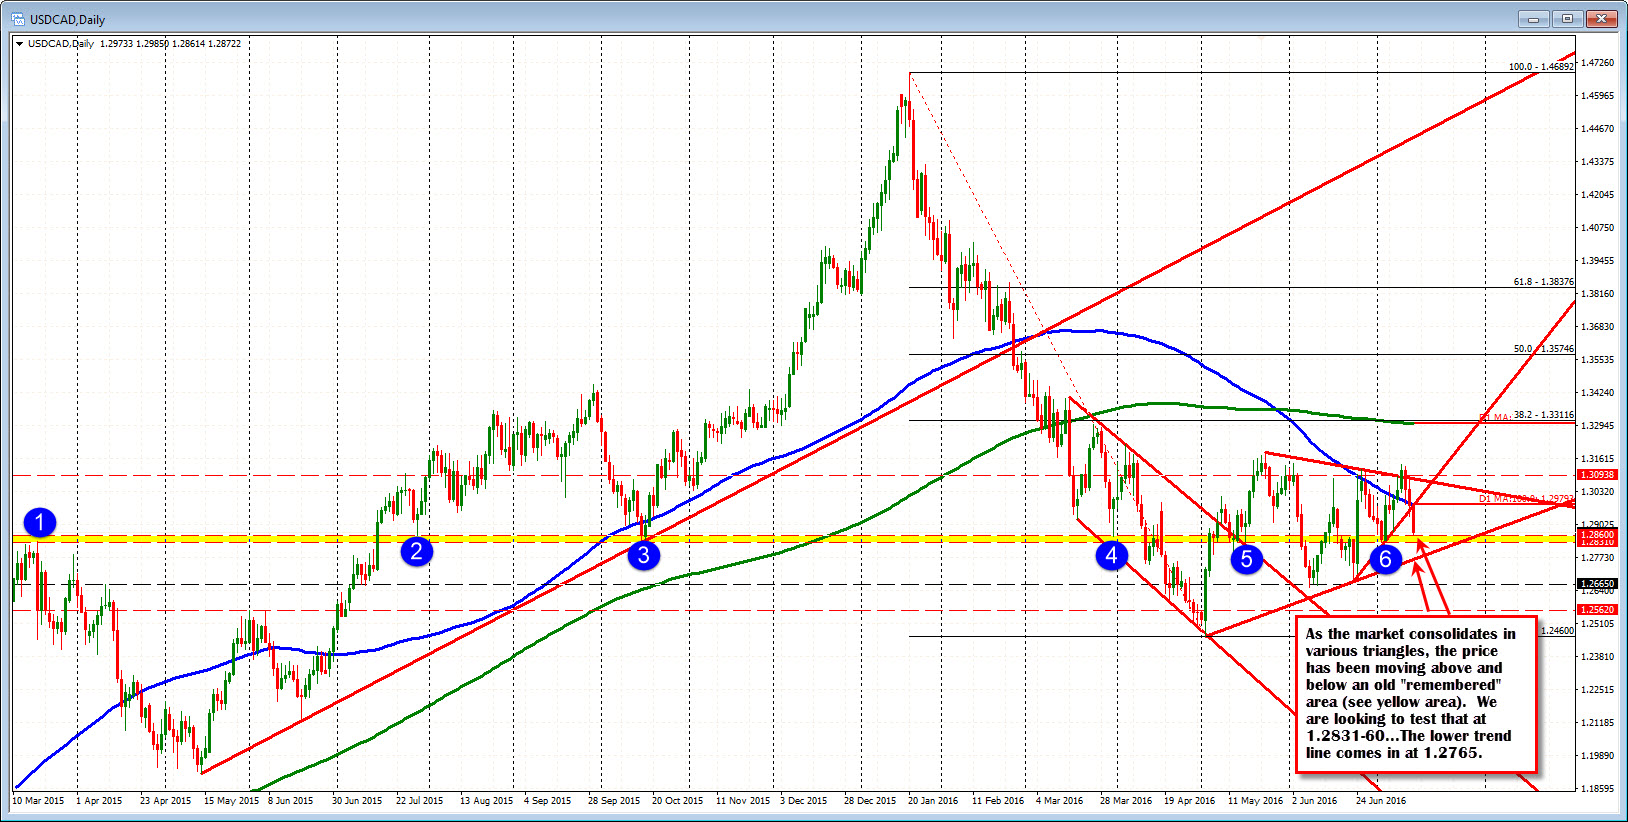
Looking at the daily chart below, the move lower is approaching an area that was a swing high and swing low area going back to March, July and October of 2015. That area comes in at 1.2831-60. IN the last few months, the price of the pair has waffled above and below that area (yellow area in the chart below). However, at the beginning of July, the price did bottom at the level before moving higher. So there was some reestablishment of the level by traders. The low today has bottomed at 1.2861 so far. Should that area be broken, the trend line connecting recent lows cuts across at 1.2765.
Admittedly, the USDCAD has seen its share of up and down choppy action over the last few months. The highs earlier this week did move above the topside trend line. That break and close above failed the next day. Yesterday's high reestablished the line as resistance. Today's break is seeing some follow through to the next target. Traders - having been burned a lot in the ups and downs - will likely continue to be cautious in their trading and take each step one at at time. Eventually, there will be a break and run, but until then, one step at a time.

