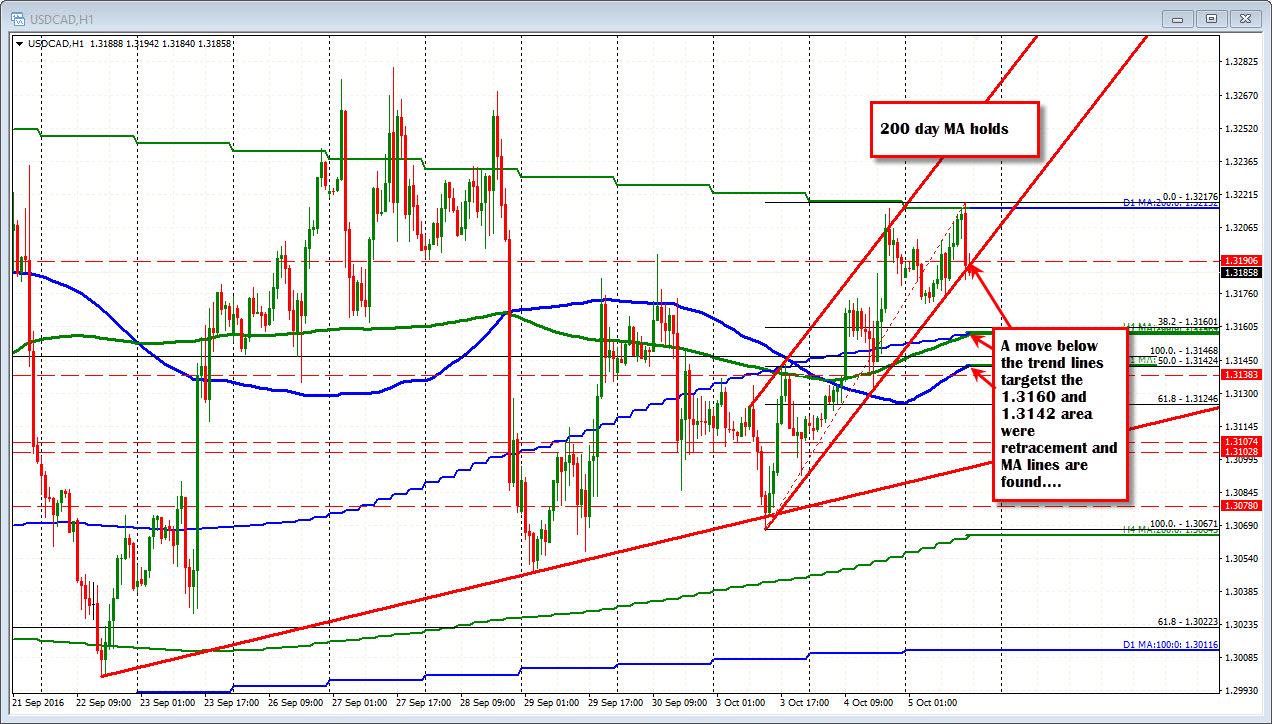
Trend line tested
The USDCAD successfully tested and found sellers against the 200 day moving average. By moving average comes in at 1.3215. The high for the date peeked at 1.32176.

The price has moved down and is testing a trend line at 1.3185. The price has moved a pip or two below that trend line but there is not much momentum on the break.
Crude oil futures prices are up $1.00 or 2.03%. This should be supportive to the CAD (weaker USDCAD). Yet the price for the USDCAD is near unchanged on the day (although it is off the highs at least).
Does the market start to pay more attention to the higher oil price, and push the USDCAD lower? Or is the market simply discounting a fall back down in oil ahead of the fact?
Key test at the trend line.
A break with more momentum, should see a move down toward the 1.3160 and then 1.3142 area where retracement and MAs are found (see chart above).


