
Above the 100 hour MA, and even above the trend line resistance, but....
If you recall from yesterday, the USDJPY moved above the 100 hour MA (blue line in the chart below), and I was hopeful that the pair would push and extend higher. The 1st target was to get above the 107.35-41 area where the most recent swing highs were located. Also in the picture was a trend line that slashed across the top. Yesterday, there was a break of that trend line but the break failed, the market rotated modestly lower but stayed above the 100 hour MA. That happens. The market rather than move just died.
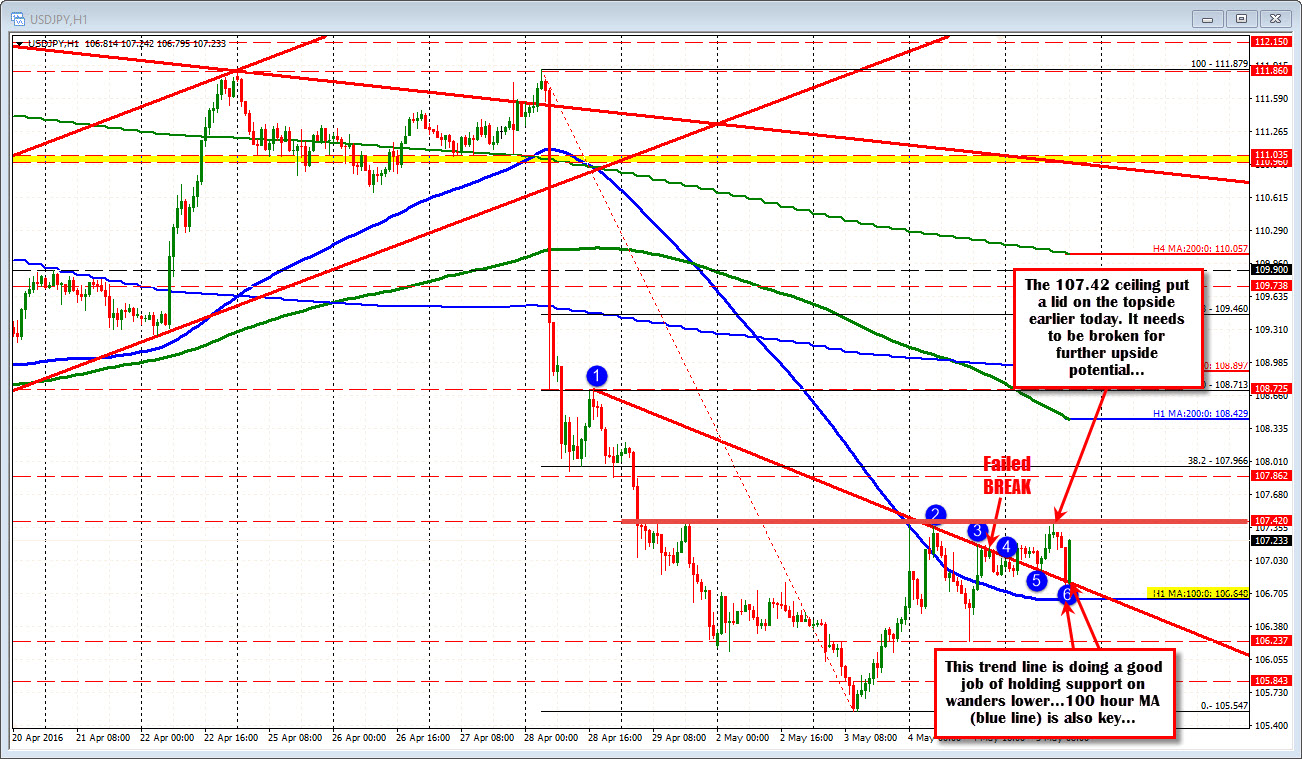
Today, was a new day, and the trend line was broken. Well maybe it was just broken because time went by and the downward slope led to a break. In any case the price did move higher but it stalled at the 107.39 - above 107.35 but below the 107.41 high from last Friday (see chart above). Sellers leaned against the line. It could not be broken. The price rotated lower.
WHere did it go?
The broken trend line. We are seeing a bounce of of it. That buying against that line could be the trade of the day. Risk was defined and limited.
So traders continue to "play" between the levels - between the lines. Off of this chart, the buyers are trying to keep the "low is in" hope alive, but you can tell from the selling at the highs, they may not be "all in". So they lean below. They may lean above. Eventually, there will be a break and run.
On the topside, that would target 107.86-96 and then the 200 hour MA at 108.42.
On the downside, a break of the lower trend line at 106.80, will have the 100 hour MA (blue line) at 106.848 as the next downside target to get below. If it can get below traders will be looking to test the other recent lows.
Buyers in charge for now.

