If the level does not hold get out. Traders did in the USDCAD today
The USDCAD has been stepping higher with each leg higher, retracing 50% before moving higher again (see 1, 2, and 3 in the chart below).
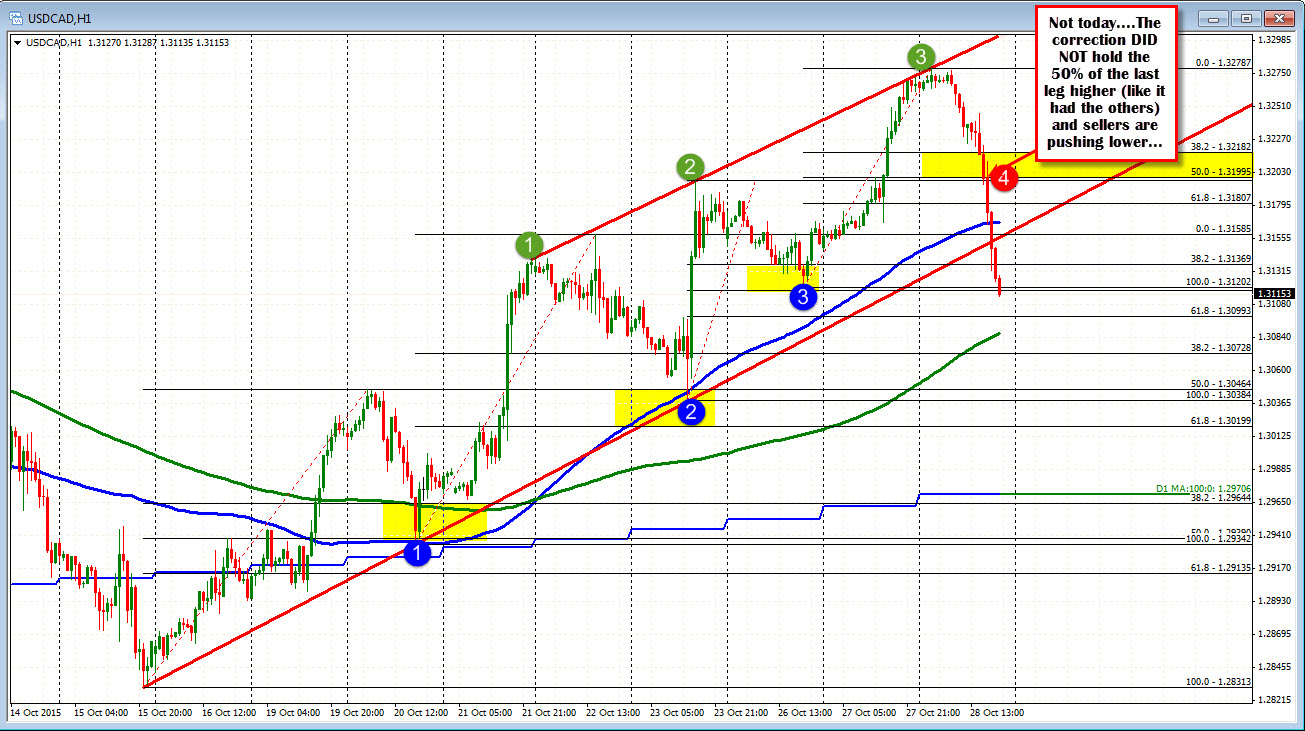
Today, the price peaked against the top trend line. Sellers came as expected, but instead of stalling and rising at the 50% level, the price stalled, then broken through. The selling intensified and the pair is now below the 100 hour MA (blue line at 1.3167)) and the lower trend line support (at 1.3155 currently). Oil prices (up over 6% today!) are contributing to the sharp fall of course.
The trend move higher ended. Sellers were able to take back some control below the 50% level.
Now what?
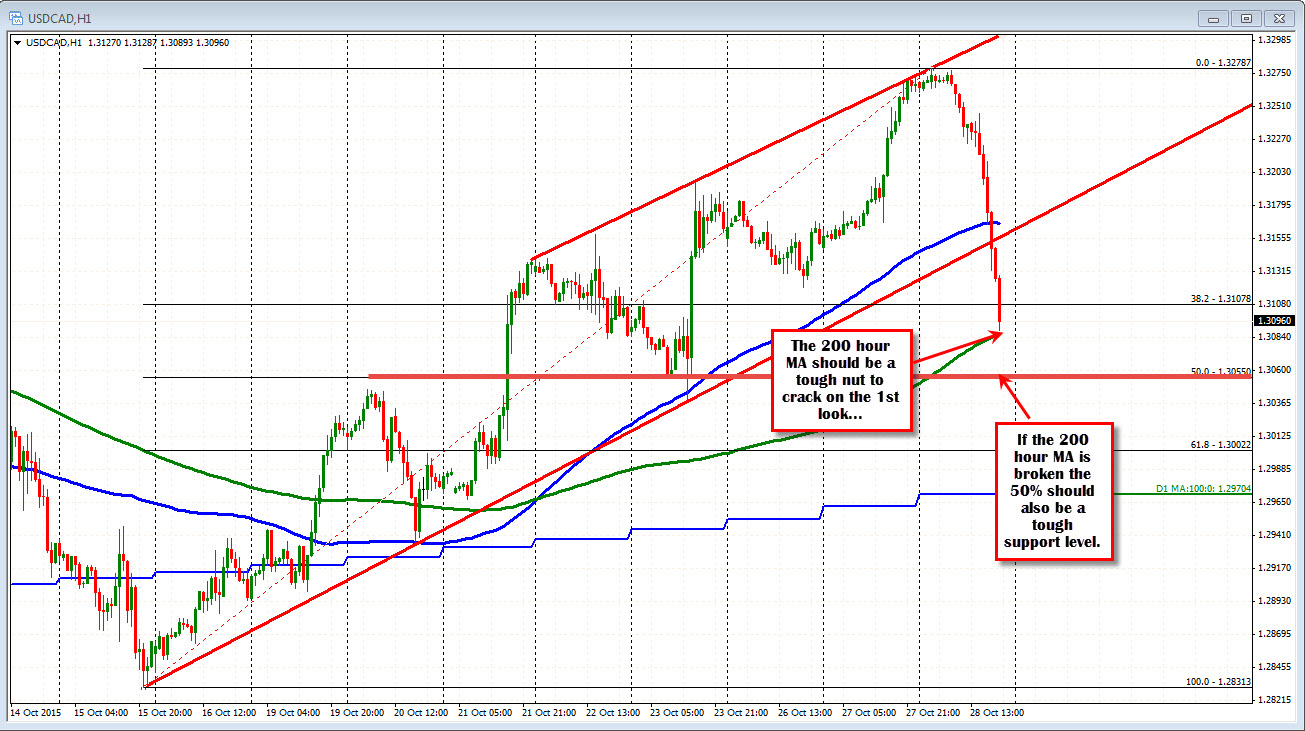
Well, if I were to extend the Fibonacci back to the October 15 low, the 38.2% comes in at 1.31078. We wer just below that level. The next target is the 200 hour MA (green line in the chart below). That level currently comes in at the 1.3086 level. This should slow the decline. It is difficult to pass through the 200 hour MA on the first look so look for support buyers.
If the price does break, the 50% of the trend move higher comes in at 1.3055. Lows from October 23rd are also there on the hourly chart.