If you don't, sell here...
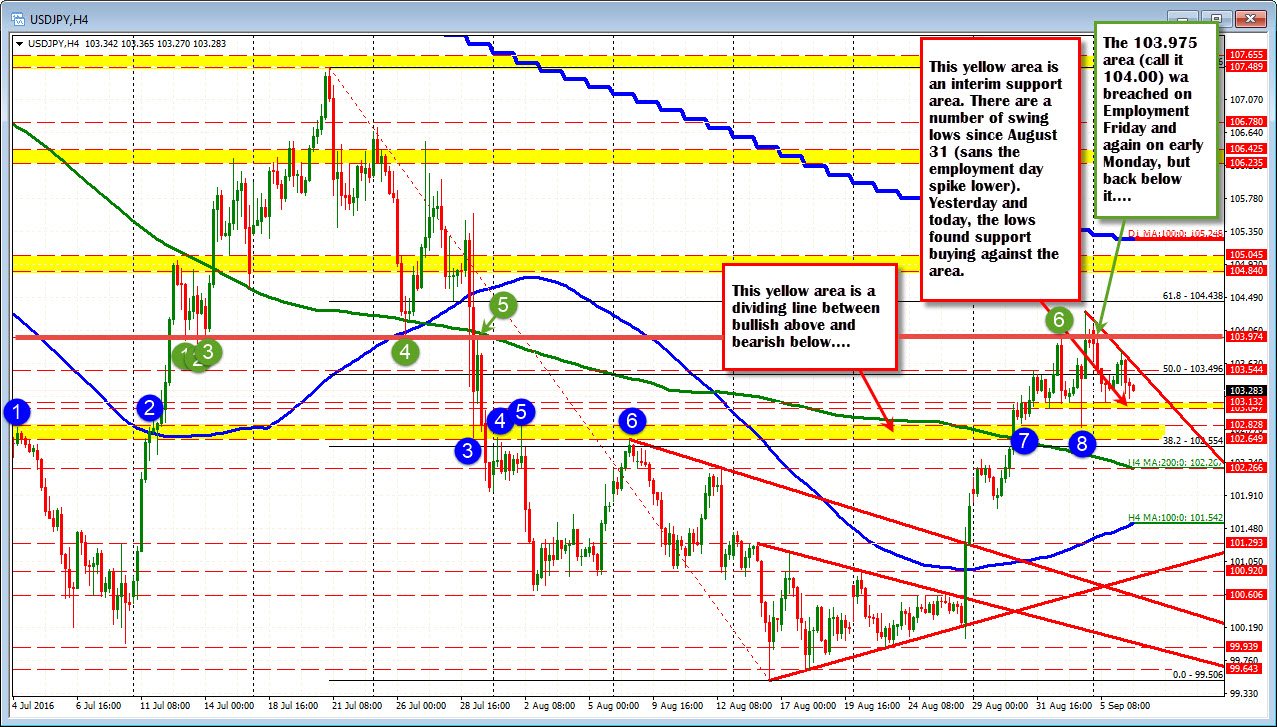
The USDJPY on NFP Friday fell to a low within an area that has defined bullish above and bearish below. It comes in at 102.649 and 102.828. Looking at the 4 hour chart, that area has been home to a number of swings lows/swing highs. Since August 30, the price have stayed above.

Ahead of that is the 103.047 and 103.132. If you discount the move below that area on employment Friday, the price has been supported there.
If you like the dollar bullish idea - i.e., the Fed tightens, this is an area you would like to see the price stay above.
Before that level, there is interim support at the 103.047-103.132. Yesterday and today, lows approached this area and found buyers. Pre-employment, the market created a floor near this area.
Now that may be support, but in trading today, the price lower on the day. The price high came in at 103.80. The close yesterday was at 103.41. The price is trading at 103.34 currently. The price is also back below the 50% of the move down from the July 21 high to the August 16 low at 103.496. Also of note is the price is below the 104.00 area. That area has been another dividing line for bulls and bears over the summer months (see green circles).
With the "hard to read" employment number on Friday (hard to read Fed too), it may not be too surprising to see the market waffle. Technically, however, the waffling has helped to define "the markets" levels of support/resistance. Traders can use those levels to lean against for trading support.
If you like the buy side, the 103.047 and especially the 102.649-828 will be eyed for support buyers (don' t want to see the price move below).
If you prefer to sell the pair, look to lean today against the 103.496 level (the 50%) and for more patient selling, the 103.975 area (call it 104.00).
Right here at 103.35 currently....sort of in the middle of the close support and resistance.


