Some signs of bullish life today, but...
The USDCHF is trading at post SNB depeg highs today (see prior post). Yippee! How is the EURCHF doing. Remember, the SNB pegged the EURCHF to its important trading partner at the 1.2000 level. When the peg was lifted, the price tumble - well collapsed - to some low way off the 1.2000 level. Way lower because there are different lows. My chart says 0.9706 (what does yours say?).

Anyway, over the last month of trading, the EURUSD has tumbled from 1.1494 to 1.0630. Meanwhile, the EURCHF has a had a more modest move lower from 1.0948 to 1.0729. So the EUR has had a more modest fall against the CHF in that time period.
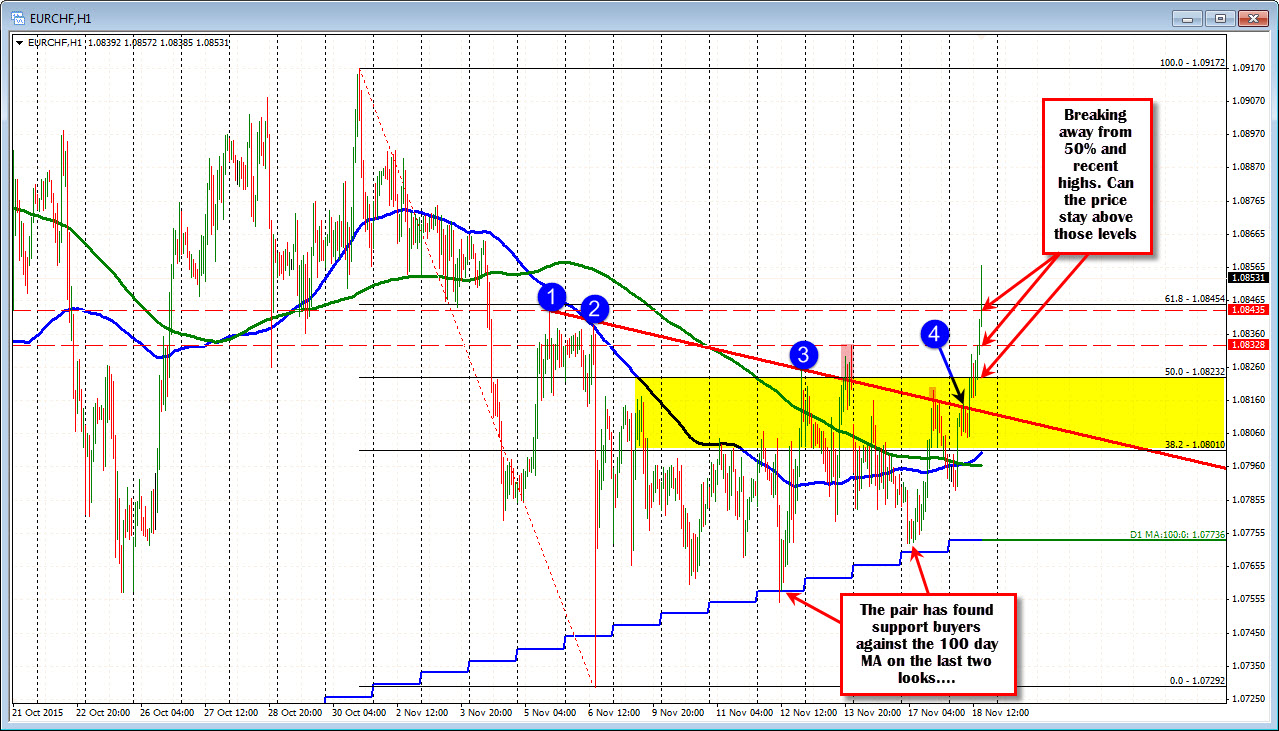
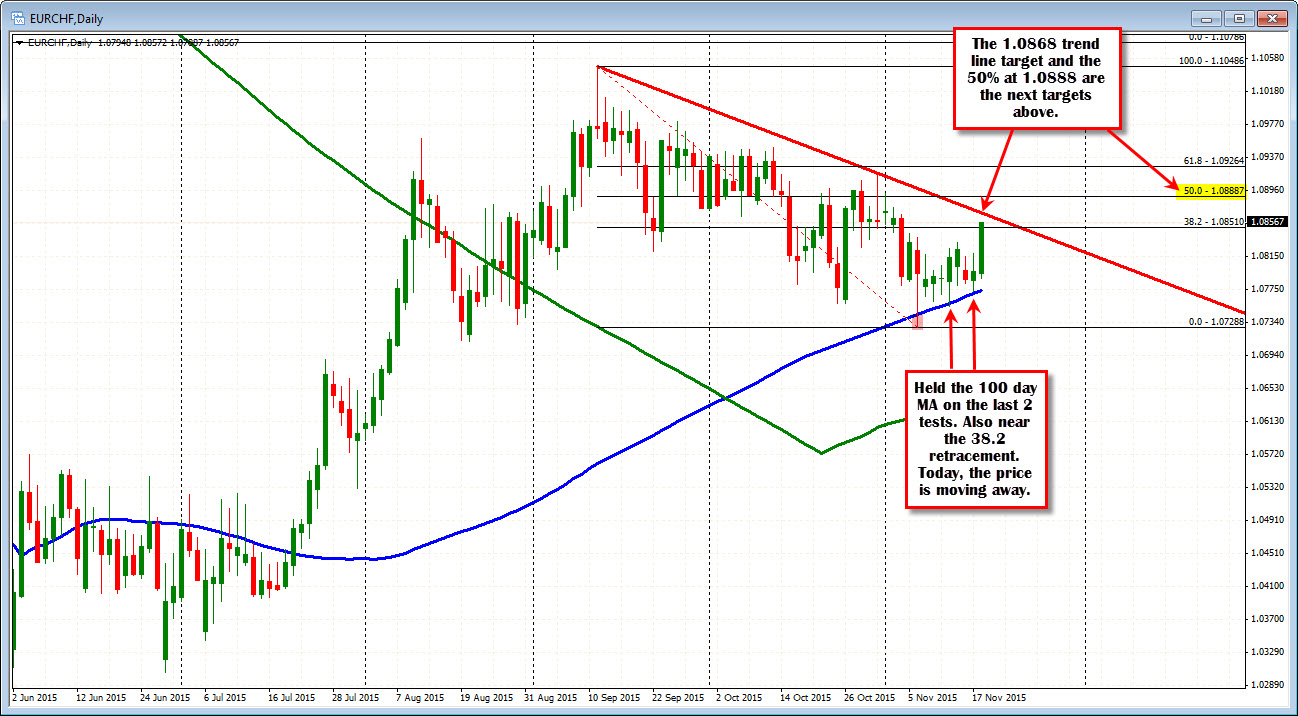
In November, the 100 day MA (blue line in the chart below) caught up with the price and has found support buying against the level. There was on break below the 100 day MA on the US employment day, but that was quickly reversed. The two other tests of the line found support buyers. You can see it closer on the daily chart below and also the hourly chart.
Today, the price is breaking higher - moving away from that 100 day MA and moving above the recent highs. THe price is also moving away from the 50% of the move down from the October 30 high. Can these breaks hold? The swing high from November 5th came in at 1.0843 . This is the closest support now. Below that 1.0832 and then the 50% at 1.0823. Each have their own importance in keeping the bullish momentum going. IF the bullish bias is to continue, there should be traders who lean against these levels on corrections.
On the topside (see daily chart above), the 1.0868 and then the 50% of the move down from the September high at 1.08887 are the next targets.