
Bears keeping in control
As Ryan pointed out (CLICK HERE), the GBPUSD plunge on Friday messed up a lot of the charts. I have seen the low on Friday (Reuters) at 1.1491. Bloomberg has 1.1841. I have heard others as high as 1.1990. That makes a mess of the charts. When you have such a large spike, the scale gets all outta whack (see chart below.
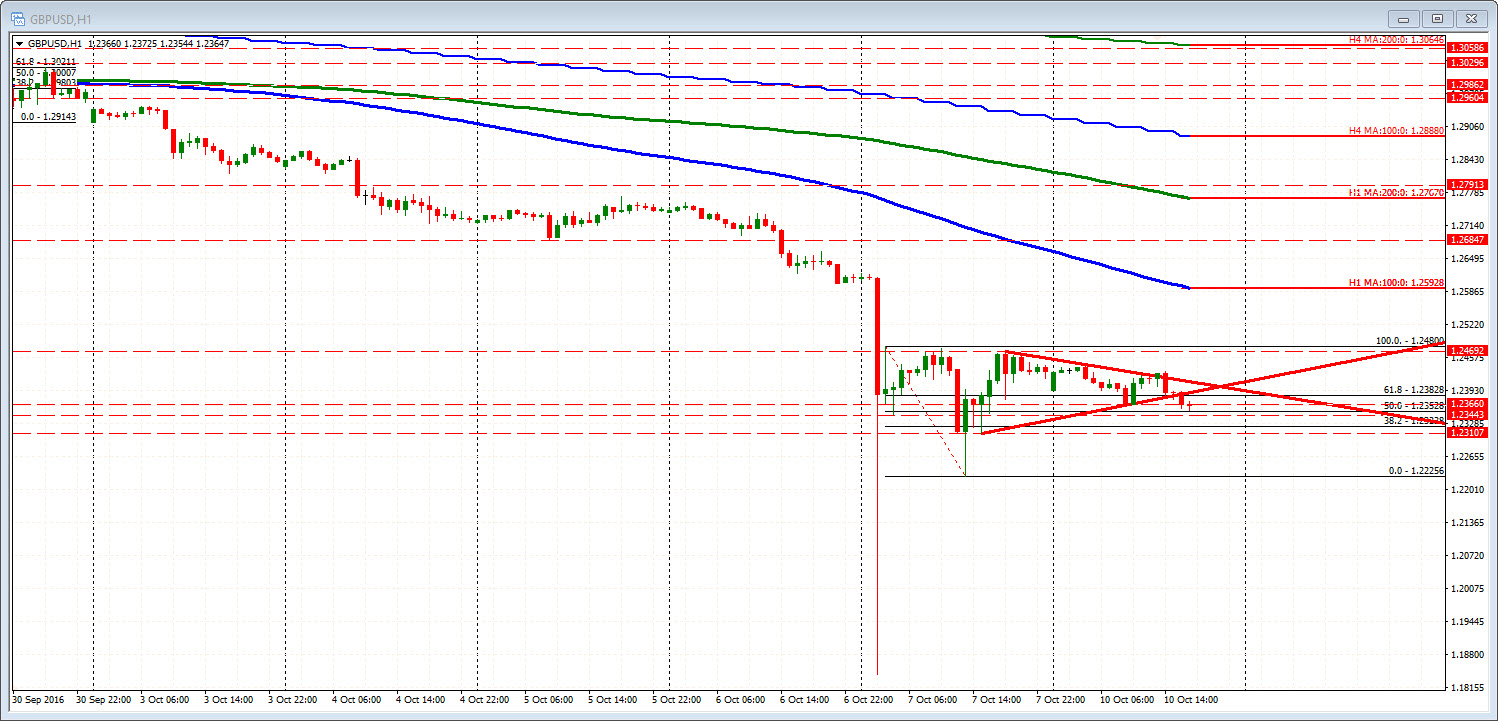
What we know is that post the crash, the markets calmed down at least a bit, and a more "normal" range traded on Friday after the first 90 or so minutes of trading after the tumble (it was a wide range but more realistic) and again today (the range today is about 90 pips).
The high price after the tumple lower moved up to 1.2480. The low extended down to 1.22256. That corresponds with the Bloomberg chart as well..
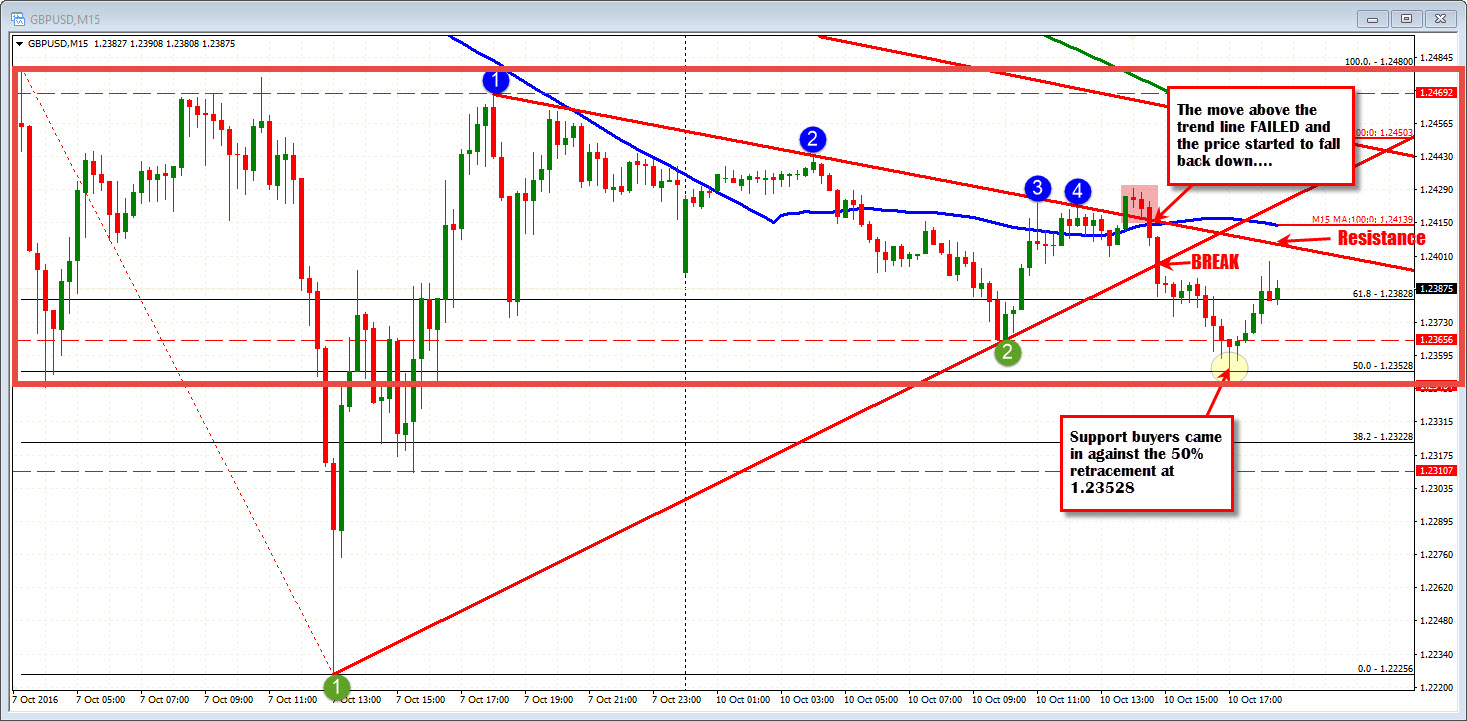
If you look at a lower time frame chart - like a 15 minute chart - you can start to "see" what traders are looking at from a technical perspective. Traders are looking at apples and apples and as a result, can apply technical tools that help in defining a bullish and bearish bias (and also risk defining levels)..
For example. by connecting highs with a trend line, you can see how the price moved above the topside trend line today. That break should've solicited more buying on the break. However the break failed (see red area in the chart below), and it helped ignite a move to the lows for the day.
Then at the lows, the price tested the 50% retracement of the post break range (from 1.24802 1.22256 – see chart below) at the 1.23528 level (the low reached 1.23544). Buyers leaned against the level.
What next?
The old trend line currently comes in at the 1.2404 level. A test of that level should find resistance (with stops above).
On the downside, support targets come in at 1.2366 and again at the 50% retracement level at 1.23528.
Admittedly, I think the "market" is learning what are levels to lean against now and that may be a process over time. However, if we can find levels that have been tested a few times (like the topside trend line) or perhaps a key Fibo retracement like the 50% or MA, we (and "the market") can start to rebuild technical confidence.
In summary, from what I see developing (see chart below), I am starting to see a range with 1.2350 on the bottom and 1.2480 on the top. Yes, there has been 11 bars that traded below that area but the vast majority of the time has seen prices trade above the level. The bias is more bearish below the trend line (and perhaps the 100 bar MA too - blue line). It will take a move above that trend line (at 1.2404) and the 100 bar MA at 1.24139 to give buyers more control.
PS Over time, the hourly chart will start to rebuild too as we get more bars (maybe in a week or two from now ). The good news - at least technically -is there was not some hourly closes at the extremes. That would have influenced the 100 hour MA or 200 hour MA (imagine having an hourly bar close at 1.1600. It would distort the MA line). The hourly MA is at 1.25857 and moving lower. If there is a rally, that would be a resistance target/ceiling.

