
61.8% Fibonacci retracement above. 200 hour moving average below
Unlike the EURUSD which is trading at new highs as US traders enter for the day, the GBPUSD is more closer to the days midpoint. Looking at the hourly chart below, the price is also between resistance above at the 61.8% retracement of the move down from the FOMC spike to the low seen on Thursday's trade, and support below against the 200 hour MA(green line in the chart below). The pair tested each extreme in trading today and moved the other way.
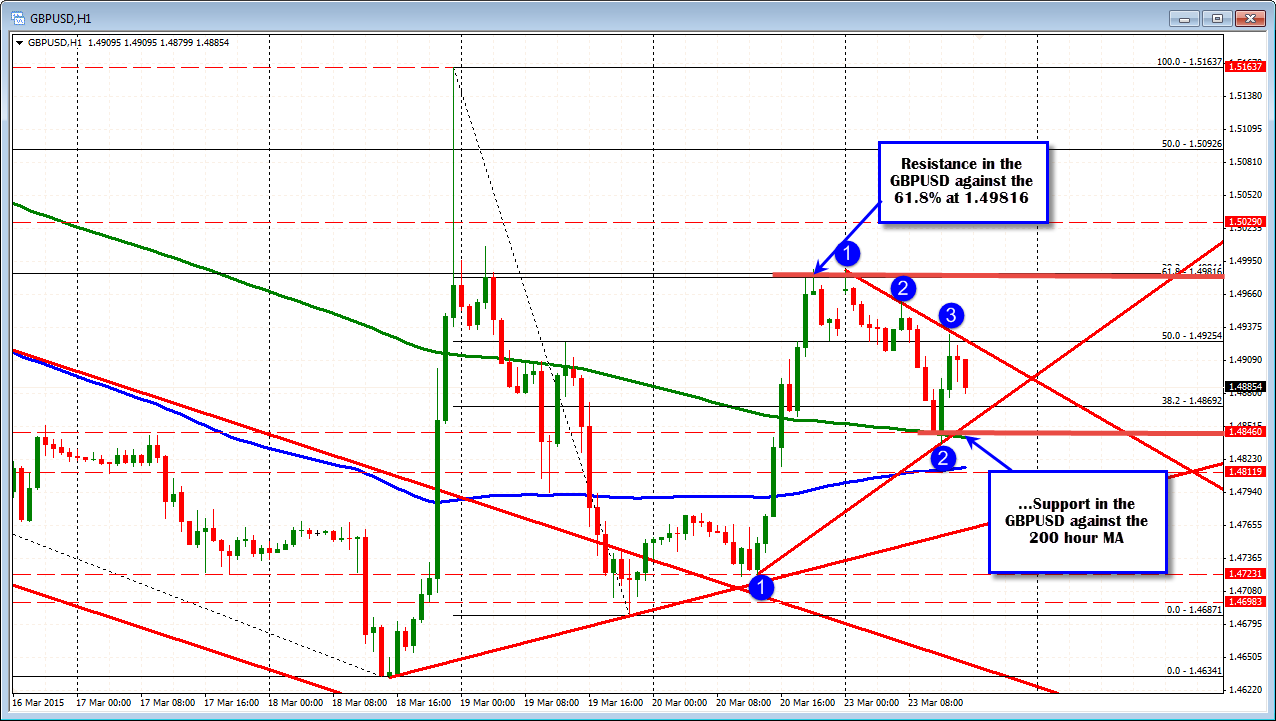
The 50% of the move down from the FOMC high and trend line resistance (see hourly chart comes in at 1.4925 area. That was tested and held over the last few hours of trading. So the sellers seem to have more of the advantage. Stay below and the bears in control. Move above and the pendulum may swing back to the upside.
As the calendar days tick closer to the election in May, the downside seems to be the favored direction for the GBP as the likelihood of a hung parliament seems to be the odds on favorite. This adds to trader anxiety and uncertainty, which is rarely good for a currency (remember the Scottish referendum).

