
That was quick
The GBPUSD is testing the topside target outlined as an extreme level in the weekend video. That area comes in at 1.4633-1.4666. The level corresponds with swing highs (see green circles in the chart below) - the most recent earlier this month (see daily chart). It sure did not take long to make that journey to the key resistance area.
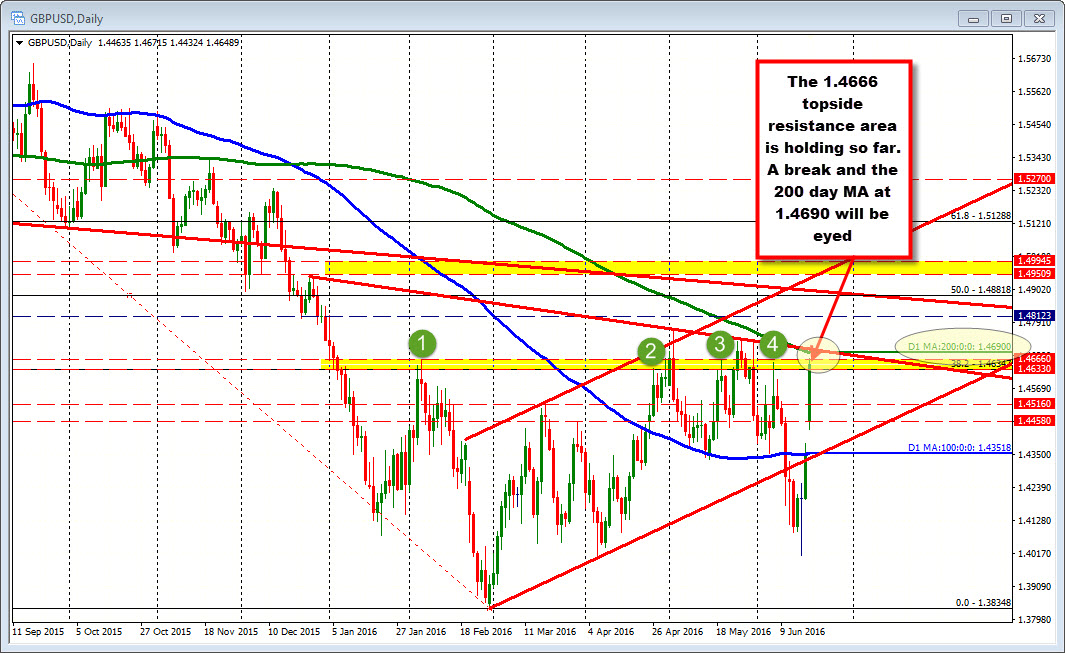
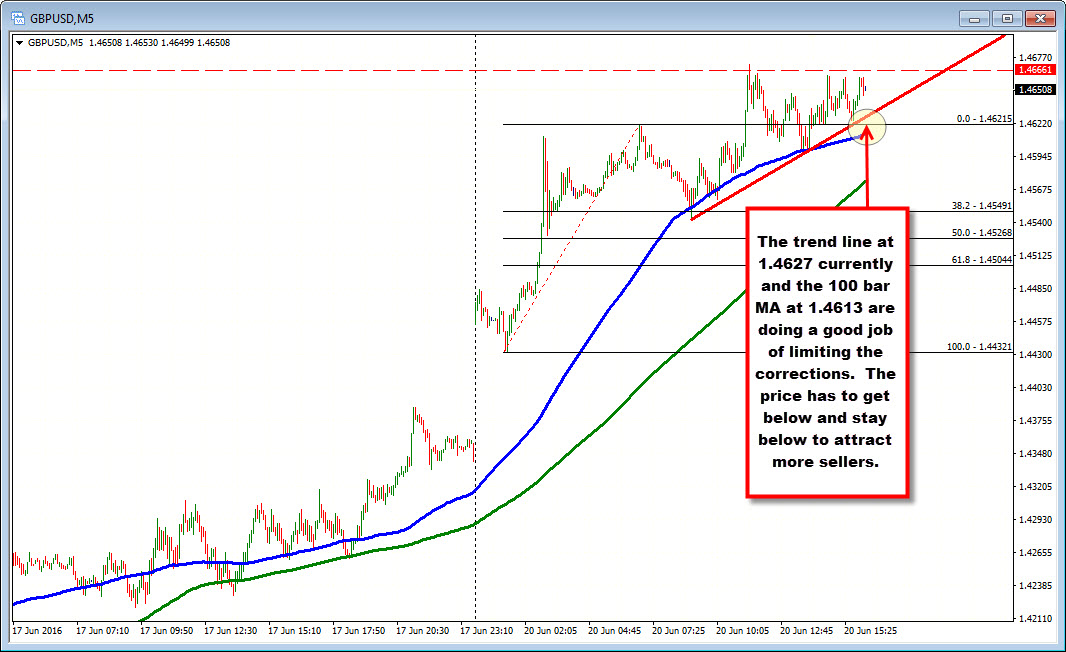
The price highs did extend higher in May in made, but only briefly. The most recent high this month respected the original high back in February. The high today got up to 1.4671. A day that went 320 or so pips higher from Friday's close, stopping within 5 pips is pretty good. Looking at the 5-minute chart below, that move was quick. The next peaks have found sellers - albeit minor - against the level. You can see the sellers are leaning and so far, the price is remaining below the 1.4666 level.
The problem (well maybe challenge) - for sellers that is - is the 100 bar MA on the 5-minute chart (at 1.4613 currently) and trend line (at 1.4627 currently) are holding support. So I have to give the slight nod to the buyers (the market is trending today to say the least). They remain in control. But sellers can define and limit risk too. Traders who are long, can take profit at a target area. So there is a battle. A good fight is on.
Shorts selling against the level will still need to see a move below those support levels. If that can be done, more sellers/profit takers may start to enter and a larger correction may begin.
Overall, the traders leaning at the highs have a technical story to tell that I can see and other can too, but a break above and we should see further stops with the 200 day MA at 1.4690 another key target.
I have my head down preparing for ACT course but with the GBPUSD at a key level, it was worth discussing.

