100 day MA proves to be a tough nut to crack once again
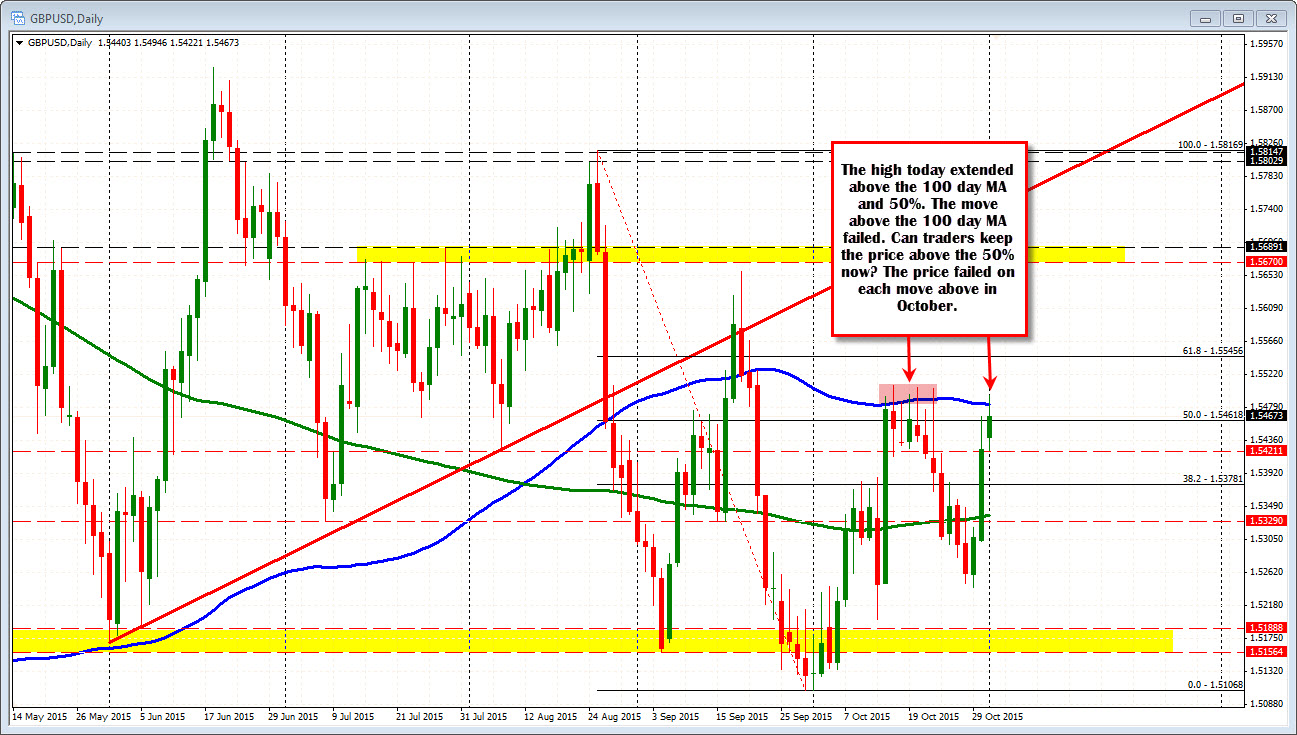
In October the 100 day MA for the GBPUSD was broken on 5 separate days. Each break could not be sustained and by the end of the day, the price has closed lower.
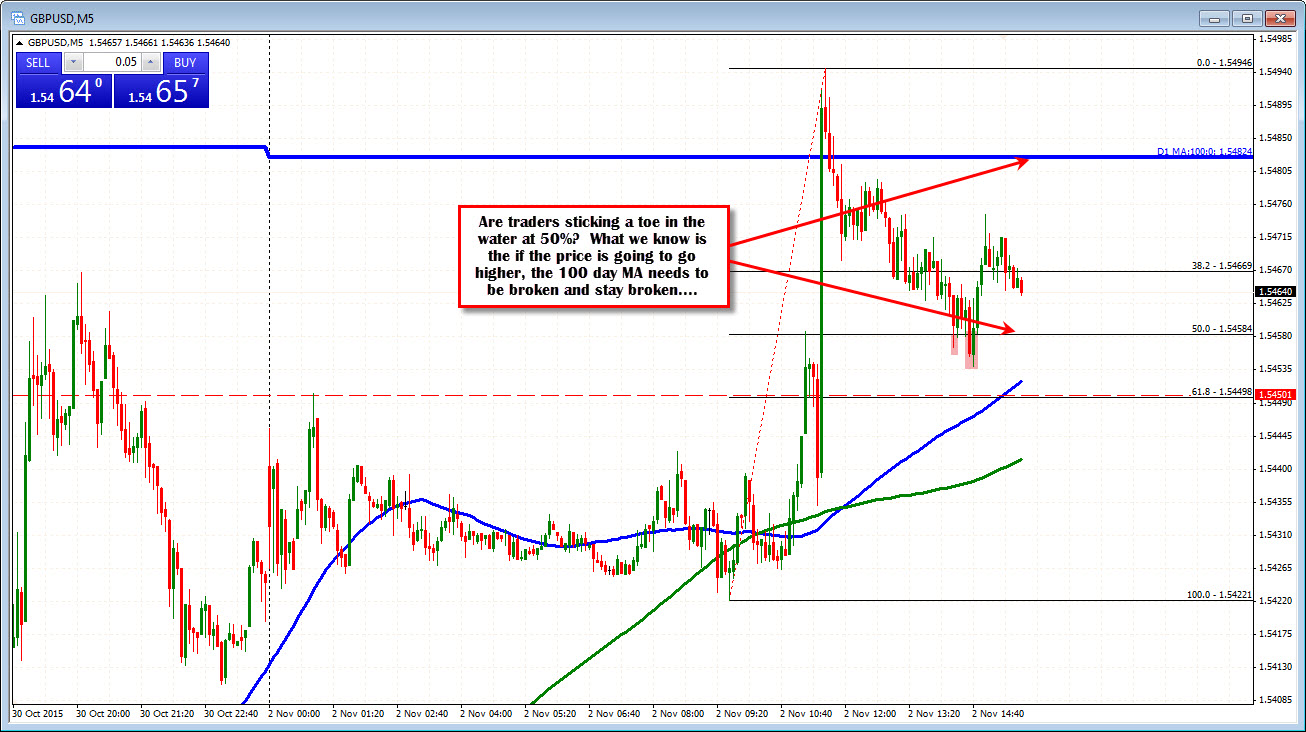
The first trading day of the new month has seen the price give another go at moving above after the better than expected PMI. The 100 day MA is at 1.54824. The high moved to 1.54946. The price failed again and the correction lower has taken the price back toward the 50% of the days trading range (at 1.5458 - see chart below).
Looking at the daily chart, the 50% of the move down from the August high come in at 1.54618. With the 50% of the days range at 1.5458, does the area represent a level to lean against? Will, if the buyers want to make a stand, why not here. If they are really not interested in life above the 100 day MA, they will explore the day's lower half. The intraday battle begins as the NY day begins...