Pair sits between support and resistance
The GBPUSD broke and trended higher yesterday. The move took the price to the 100 day MA at 1.54837. The range was large at nearly 250 pips.
Today, the price extended above the 1.5500 level but backed off as the US data loomed.
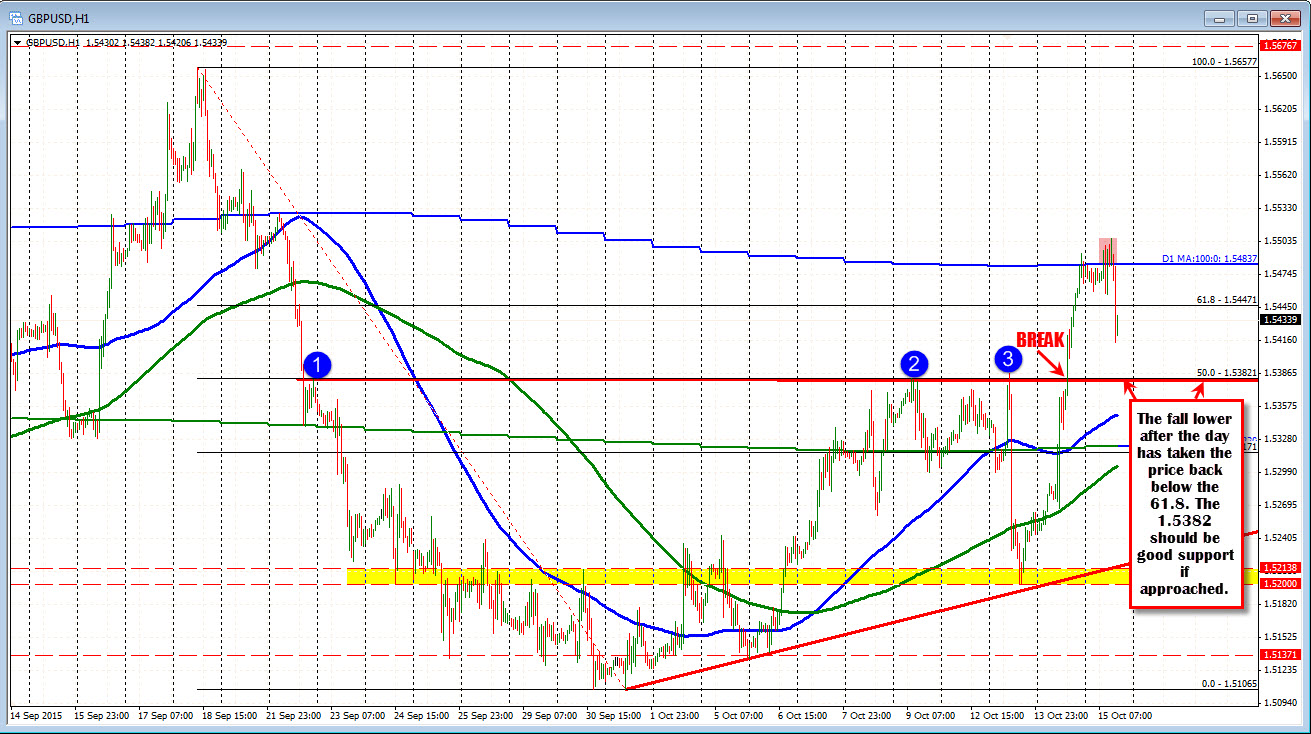
The better jobs and not bad CPI, sent the dollar back higher (the GBPUSD lower) and the price further away from the 100 day MA. The decline has taken the price to a low of 1.54147. Support - looking a the hourly chart should be pretty strong at the 1.5382-90 The 50% midpoint of the move down from the Sept 18 high comes in at that area. There are also a series of swing highs (see blue circles in the chart above). With the 100 day above at 1.5483 and support below at 1.5382 area, the price is between the two extremes.
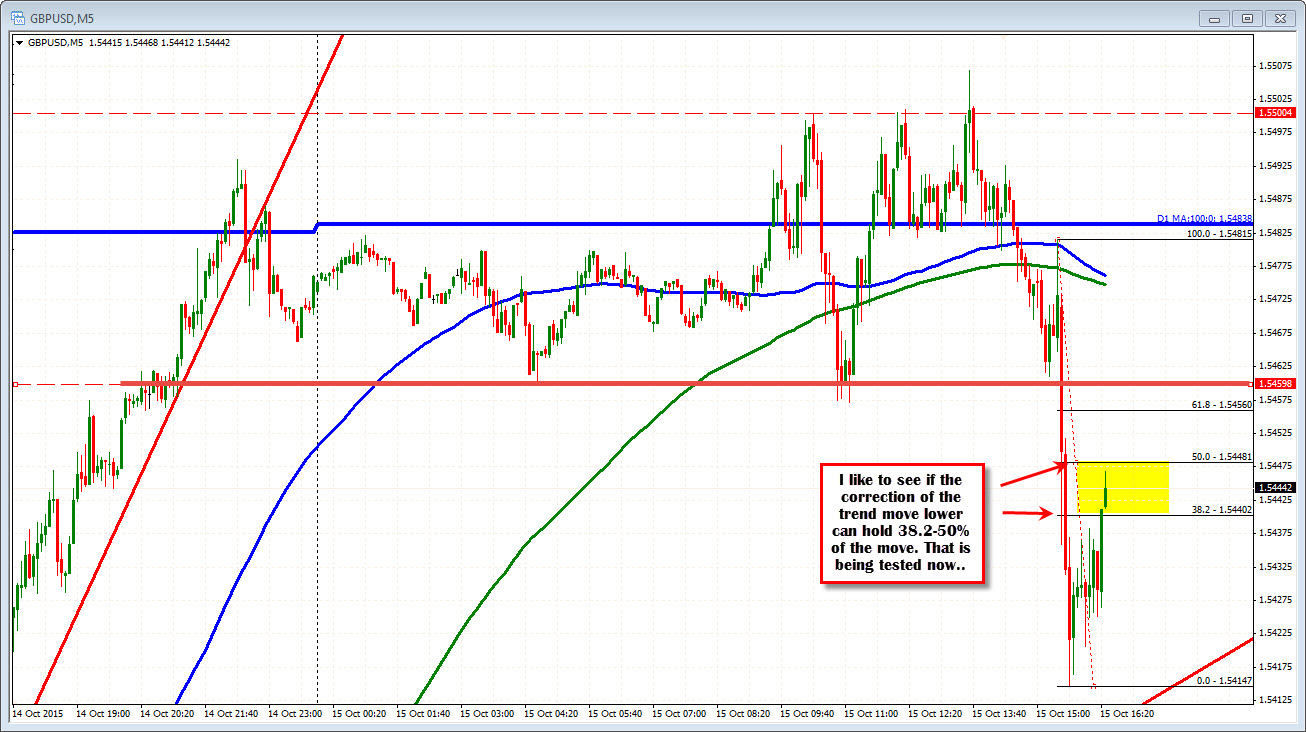
Looking at the 5 minute chart below, I like to see the 38.2-50% of a trend move hold resistance. It shows the sellers like the downside if they do show up at that correction zone. The price is currently testing that area (see yellow area in the chart below). If they do not show, the next target above comes in at 1.5460 earlier low area today). The midpoint of the day's range comes in at 1.5460 as well.