
Trades above and below the 200 hour MA
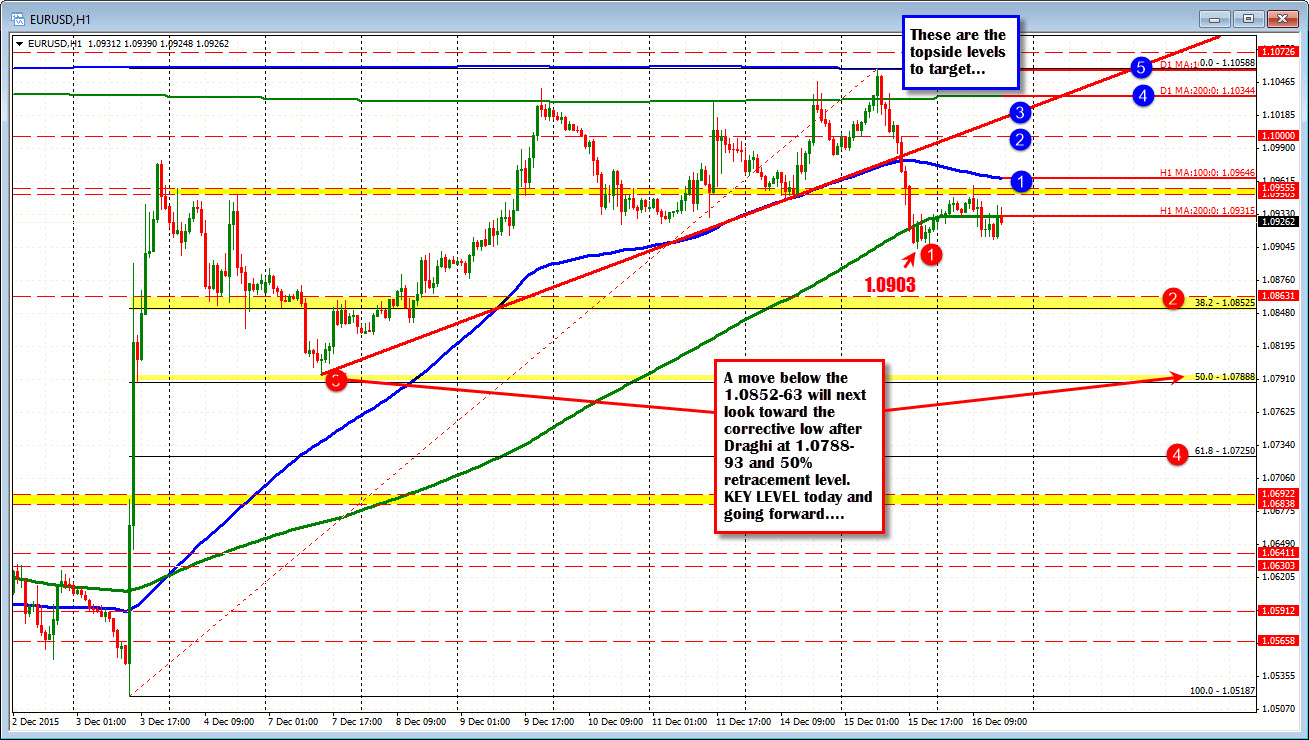
The EURUSD has been trading in a narrow trading range today - trading above and below the 200 hour MA (green line in the chart below) in the process.The housing data just out is good news with starts and building permits up and higher than expectations. The industrial production data, not so good. So the EURUSD has been moving above and below the 200 hour MA (green line in the chart below). The moving average is at 1.0931 and it looks like that line has "flat-lined" as traders wait for the Fed decision and presser starting at 2 PM (presser at 2:30 PM ET).
What levels are key through the decision today?
ON the topside,
- the 100 hour MA (blue line in the chart above) comes in at 1.09647 currently and moving lower. Before that level I could say the 1.0950-55 where there have been a number of swing highs and lows (see upper yellow area. By the time of the Fed decision later today, the negative slope of the 100 hour MA line will have moved it closer to that area. So first step would be to get above that MA line and stay above
- From there it becomes a race to the 1.1000 level
- The 1.1021 area is the underside of a broken trend line on the hourly chart
- The 200 day MA at 1.1034 has been breached 3 times in the last 6 days with two hourly bar closes above (yesterday). So there has not been much love above this level.
- The 100 day MA at 1.10588. Yesterday, the pair moved above the 200 day MA, but stopped right at the 100 day MA. A move to this level would be about 150 pips for the day range given the current low.
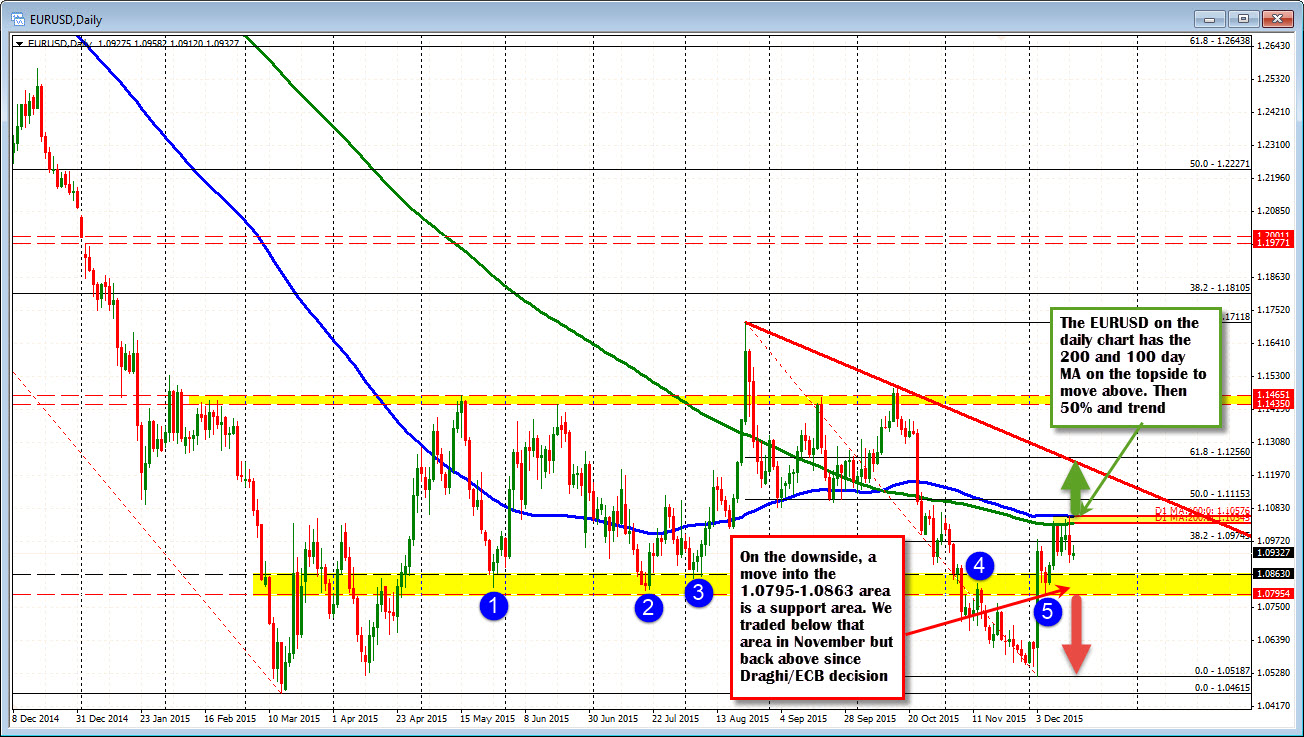
- 1.1115. This is the 50% of the move down from the August high (see daily chart below)
- 1.1237.-1.1256. This is trend line connecting August and October highs. The 1.1256 is the move down from the August high (see daily chart)
What would lead to a move higher?
- No change
- A change but a really dovish Fed statement
- A change with lower central tendencies
- A change with a sharply lower dot plot (last dot plot in September averaged 1.375% for 2016).
What are the levels below to eye?
- 1.0900. The low this week came in at 1.0903.
- 1.0863/1.0852 (38.2% - see hourly chart above) down to....
- 1.0788-95. The 1.0795 to 1.0863 area is where there are swing lows and highs going back to May (see daily chart below). The low corrective point after the ECB/Draghi spike came in at the 1.0795 level on December 7th. The low corrective point on the day of the ECB decision was at 1.0788. The 50% of the move up from the low on the ECB day comes in at 1.0788. So that area is key for the bears today, tomorrow and going forward. A move below opens the door for further selling momentum
- 1.0725. This is the 61.8% of the move up from ECB low.
What would lead to a move lower?
- More hawkish Fed with heightened concerns about inflation
- Higher central tendencies
- A dot plot (last dot plot in September averaged 1.375% for 2016) that suggests 4 tightens in 2016.
Honestly, I get the feeling the reaction might be volatile with a move lower on the reaction and a move higher thereafter. Stock market reaction might be an influence. The market will then move into the holiday mode and then look forward to the data ahead to start pricing in when the next one will come..

