
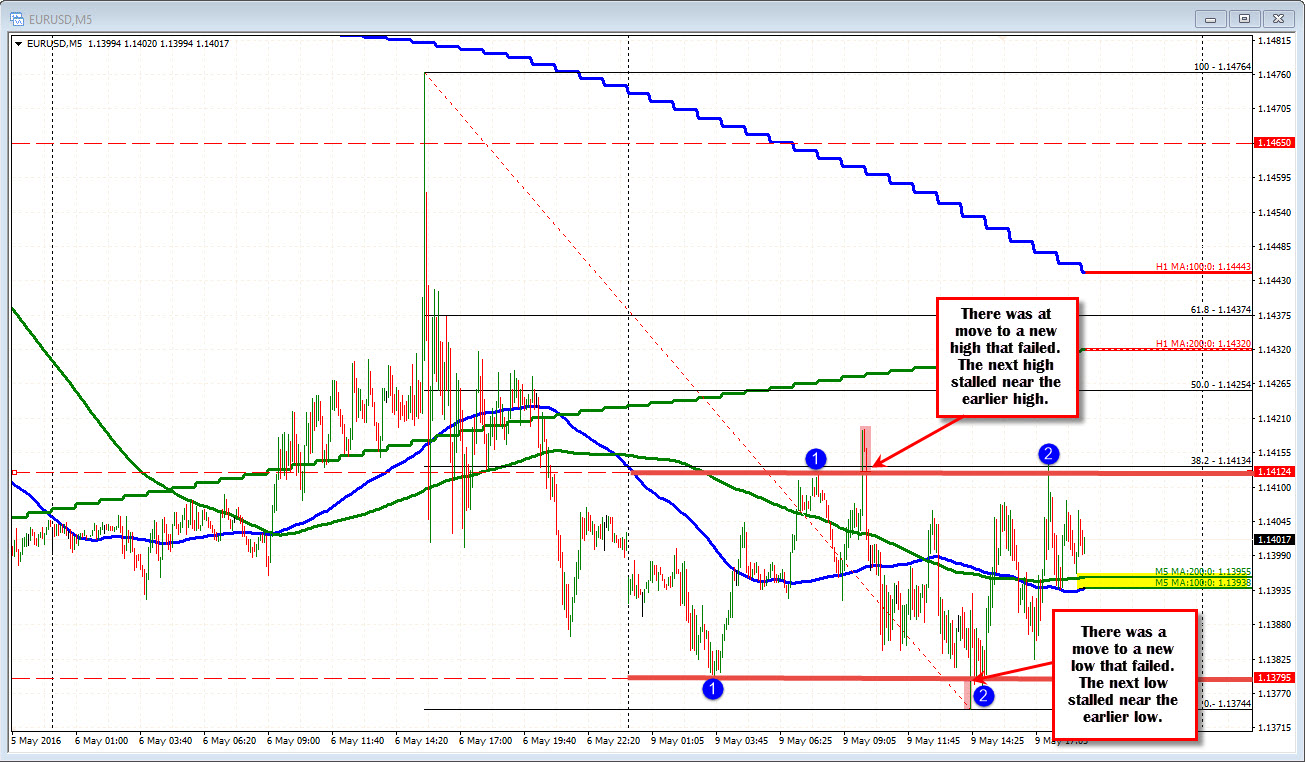
Price action is non trending
The price action in the EURUSD is non trending. Looking at the 5-minute chart, the pair is mired in a 44-pip trading range. The price tried to extend higher on one look and failed. It tried to extend the range lower on one look and failed. The close Friday was at 1.1403. The price is trading around 1.1403. The 100 and 200 bar MA are nearly identical (see blue and green line in the chart below). The price is above those MAs (bullish?). The price is below the 38.2% at 1.14134 (and held on the last swing high). That is more bearish. The 5-minute chart is a coin toss.
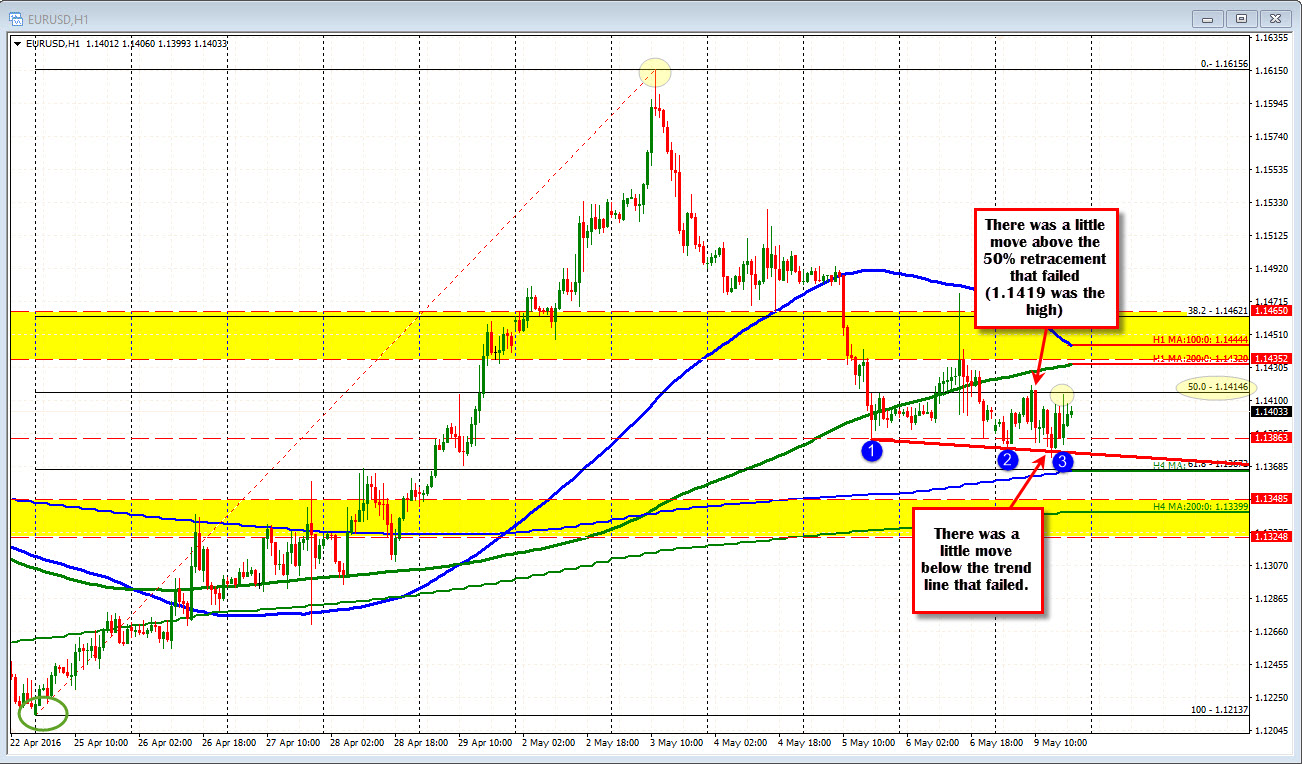
What about the hourly chart?
The bullish on the hourly chart is that the trend line connecting lows is basing. The bearish is the price on the last correction stalled ahead of the key 50% retracement level at 1.14146. The high today did make it to 1.1419 but we know that peak quickly failed on the 5- minute chart. We are lower off last week's highest high since August 2015, but stalling. The traders are looking for a break back above 50% or below the low trend line and then the 100 bar MA on the 4-hour chart (blue step line in the chart below at 1.1367).
The 5-minute and hourly chart show the buyers and sellers are battling. What about the daily chart?
Taking a broader view of the market and the bias, what I have been harping on with this pair is the 1.1435-65 area. This area has had a number of swing highs going back to Feb 2015. There have been a total of 6 trading days where the price has closed above that level since Feb 2015. That is not a lot. Last week, was the last look. Staying below keeps me more bearish. Now there is a level that is holding the line below. That is the Feb 2016 high at the 1.13755 level. That swing high was pretty significant at the time. We came down to a low today at 1.13745 - one pip below that old swing high. Is it significant? Let's say getting below it would be welcomed.
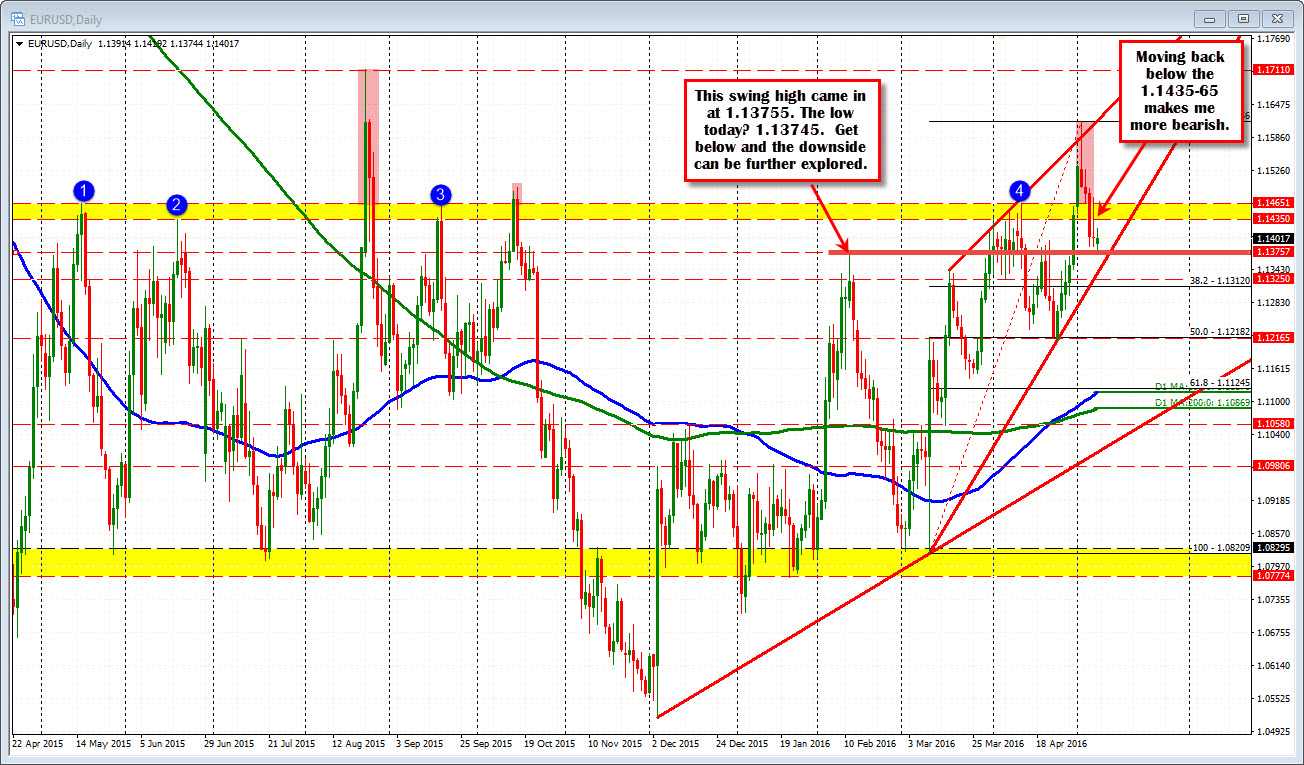
Given the daily bearishness and failure last week, a move lower through the 100 and 200 bar MA on the 5-minute chart would turn the intraday bias more negative. Then it is a matter of getting to and through the 1.13374/75 area. With a range so narrow and the action limited we can still go either way (we could go test the 1.1435-65 level too). So be aware, but there seems to be more of a lid on the pair.

