
Up then all the way down
The EURUSD has completed a lap in trading today - first rising in the Asian Pacific and early European trading. Then falling in the London morning session. The low in the early part of the day, was equaled later at the 1.1152 level.
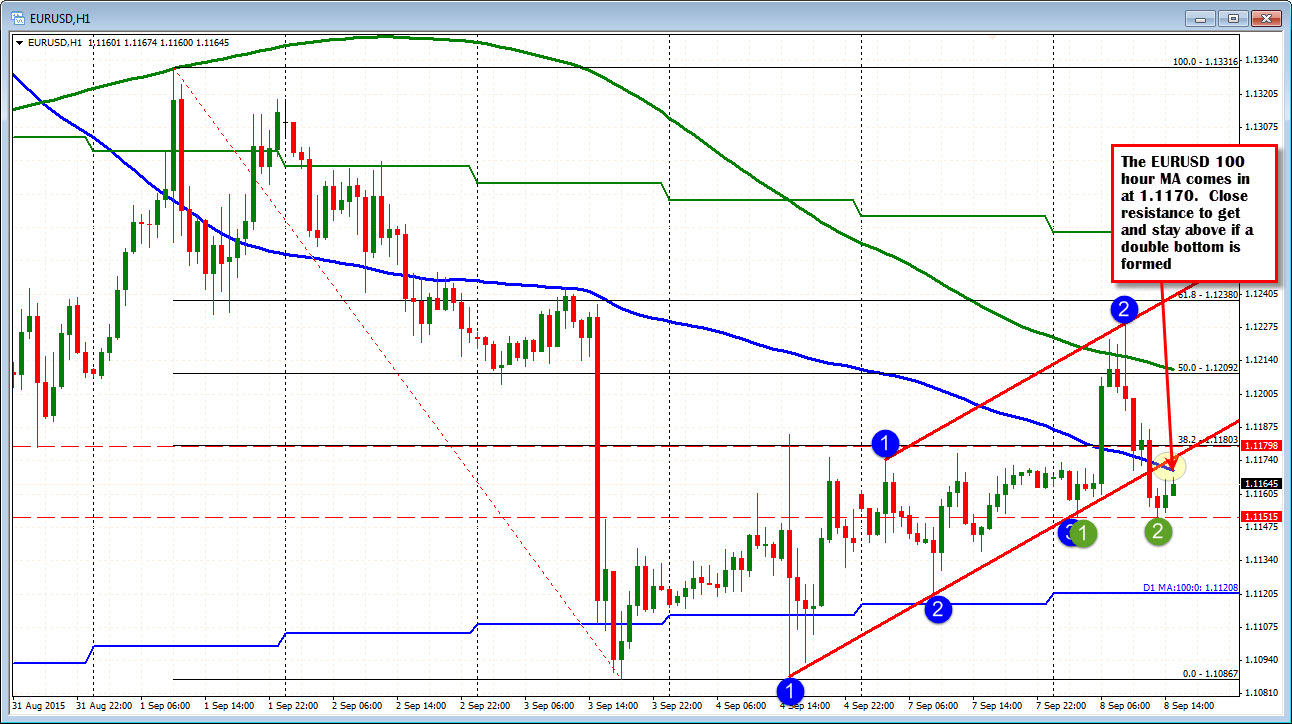
The high price was able to see the price break above the 50% retracement of the eight-day trading range at the 1.1209 level, and also the 200 hour moving average (green line in the chart above). However, those breaks could not be sustained. The pair came tumbling down an completed the lap back to the prior day's low.
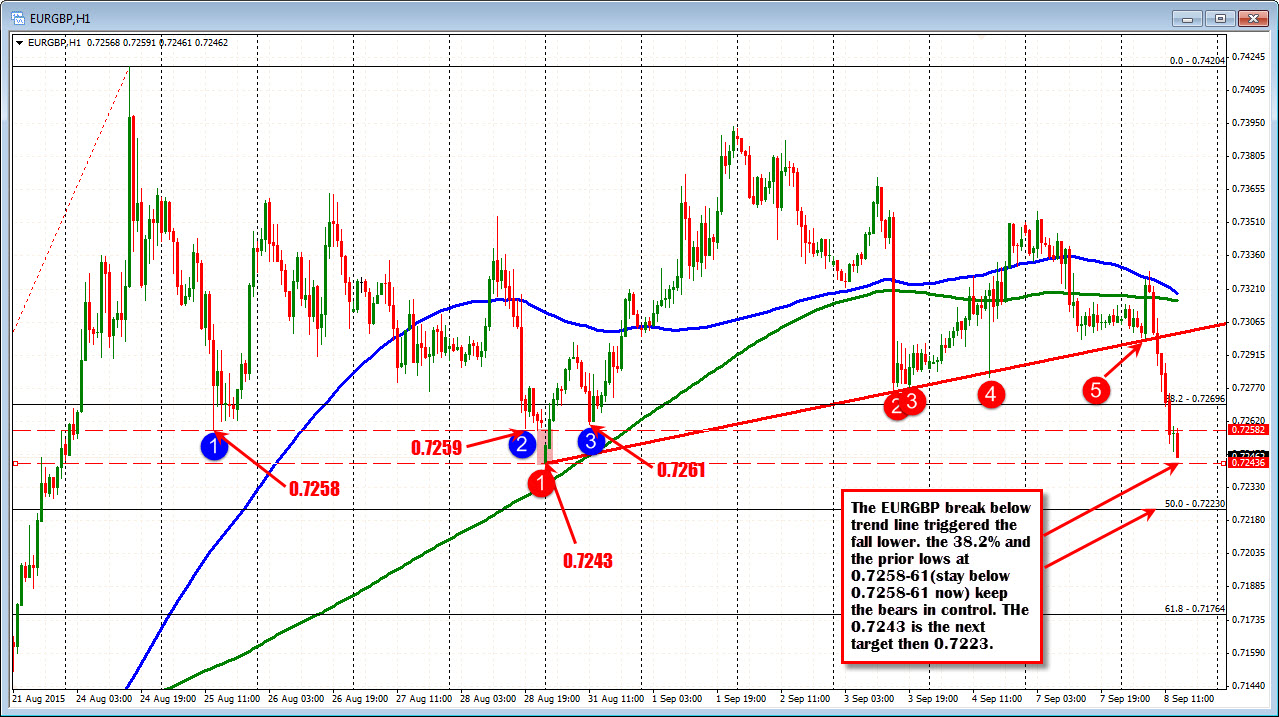
In addition, selling in the EURGBP helped contribute to the fall from the peak (see chart below). In effect the tail is wagging the dog (i.e., EURGBPY is bullying the EURUSD as traders hedge using the pieces) and make for difficult conditions in the pair. Looking at the EURGBP chart below, the pair is near support at the 0.7243 level. So perhaps the EURUSD can settle into it's own rhythm.
What would that be?
Technically speaking, the fall below the 100 hour MA (blue line in the EURUSD chart above at the 1.1170 level should be bearish for the pair (see how the pair stalled a the 100 hour MA on Sept 2 and 3). The fall below the trend line (currently at 1.1175 should also be a bearish clue for the pair. Stay below each, and the bears remain in control, with the next major target looking toward the 100 day MA at the 1.11208 level where buyers leaned against in Friday's trade.
Helping contribute to the technical picture is the rising stocks. US stocks are expected to rise and there is the camp that thinks if the global stock market worries can stabilize, the fed will pull the trigger on raising rates. That should keep a lid on the EURUSD (keep the dollar supported)
Of course, the EURGBP could have a say in the direction. It currently trades right around the 07243 level.

