Can the market follow through.
The EURUSD is like a tale of two cities. In this case it is a tail of two trading sides. One is a sell, sell, sell. The other is a buy, buy, buy.
On the sell side, I refer to the 4-hour chart because it shows more clearly what I am seeing.
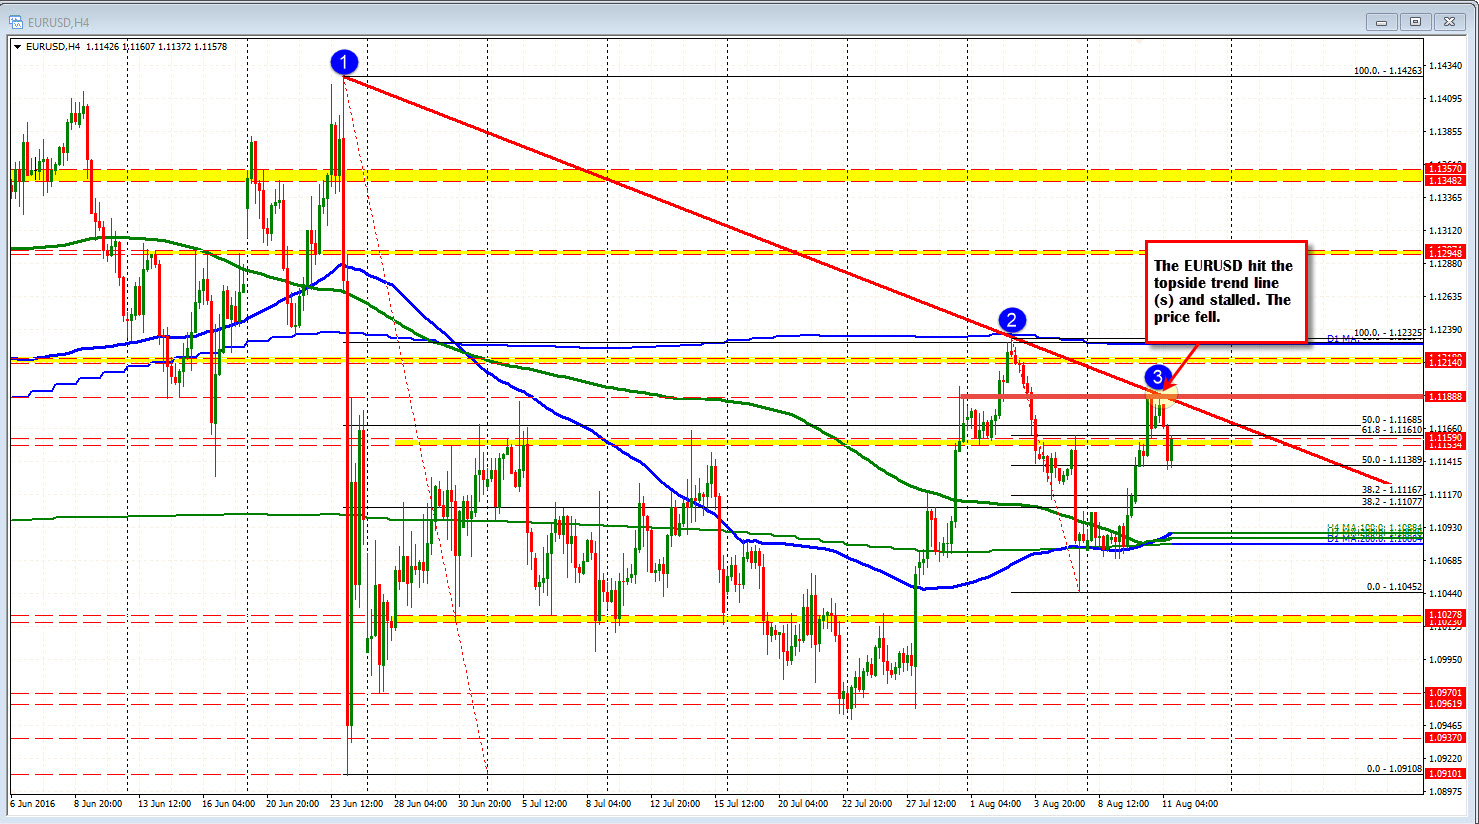
Looking at it, the high in the Asia-Pacific session all right at a topside trendline, and also near a remembered line defined by recent highs/lows at 1.1188. Why did it hold? Traders could define and limit the risk. The price moved lower (see chart above).
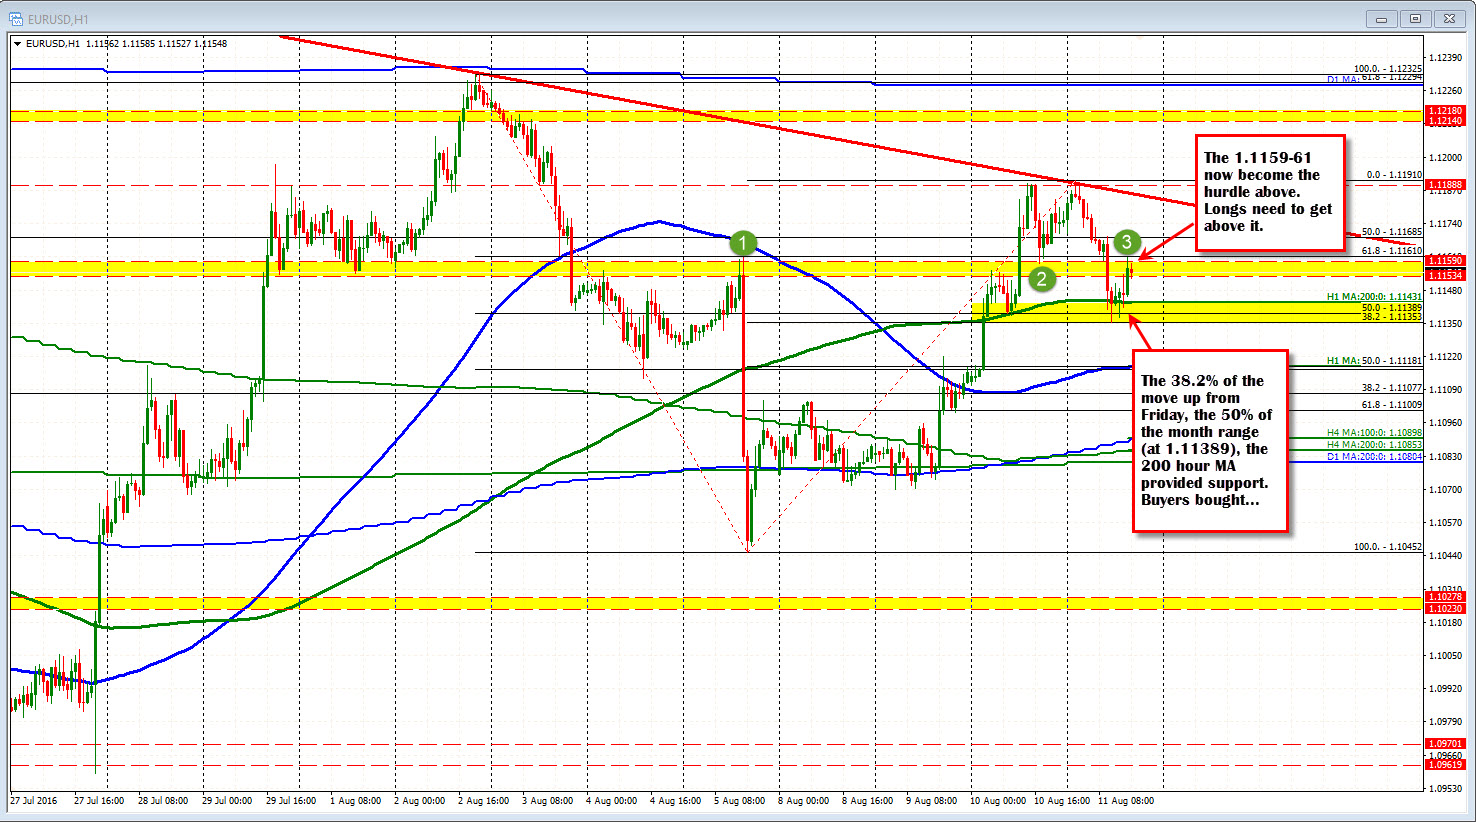
The other side of the trade (i.e., the buy...buy....buy side), a will switch to the hourly chart. If you look at that chart, the buy...buy...buy bias comes from the test of the 200 hour MA and the 50% retracement area (1.1138-43). Yesterday, the price moved above this area, stalled a little, based, and moved higher. Today the action is from the other side, but traders did a similar thing. They defined and limited risk,leaned against the area - the area was definitely tested hard - but we have seen a move back higher. PS. If you put a fibo from the low on Friday to the high today, the 38.2% was at the same area.
The buying has taken the price up to 1.1161.
What next?
Well there is resistance at the 1.1159-61 area. The 1.1161 was the swing high from last Friday. The 1.1153-59 has been other swing levels. If we are to continue going higher, that area - if broken - should give the upside a boost. If not....if the sellers are stronger (i.e. the buyers from below bail or new sellers emerge), we will see the battle continue between support at 1.1135-43 and resistance at 1.1159-61. That is trading, but the trade is in front of us. We know the challenges, the hurdles, the levels. Which side will win? If you trade the levels if you are wrong, you lose a little. If you are right, you stand to make more than a little.