100 hour MA in EURGBP being tested
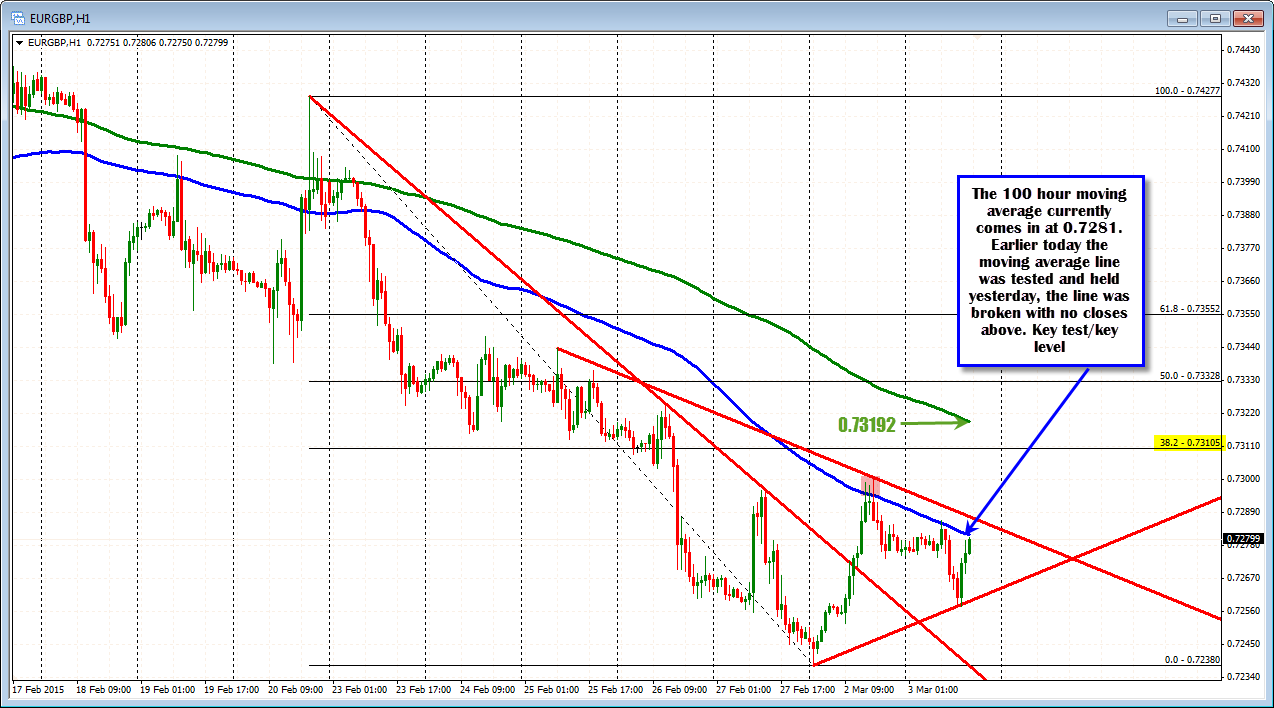
The EURGBP is currently testing the 100 hour moving average at the 0.7281 level. Earlier today that moving average was tested and held. Yesterday, the line was broken, but there were no closes above the key moving average level. A break above and close above should solicit more upward momentum. Yesterday's high at 0.7300 and the 38.2% retracement at 0.73105 are the next targets. Above that is the 200 hour moving average (green line in the chart below. That level currently comes in at 0.73192.
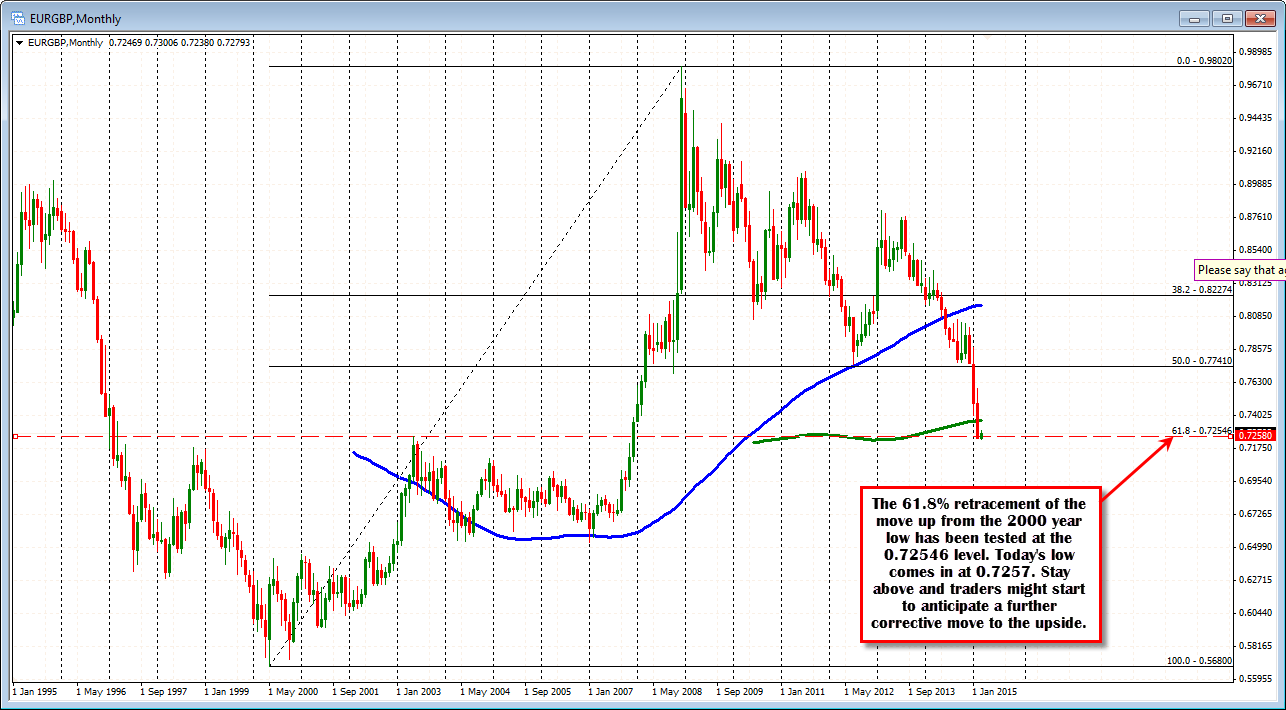
Longer term, the pair has been trending to the downside (see monthly chart below). Yesterday, the low traded at the lowest level going back to 2007 (at 0.7238). It also moved below the 61.8% of the longer term move up from the 2000 year low to the 2008 year high at the 0.72546 (see monthly chart below) and the high price going back to May 2003 at 0.7258. However, the selling could not be sustained, and the price closed back above those key levels.
The low today came in at 0.7257 - three pips above that key Fibonacci support level and the 1 pip below the 2003 year high. So buyers seem to be leaning against those key technical levels.
Is a low in place? It is worth a shot with risk defined and limited. I would expect dips to be bought with stops below the 0.7250 level.
Get above the aforementioned resistance (100 hour MA) and there should be additional upside momentum.