Holiday sideways.
The EURGBP is trading as if London traders are on holiday and indeed they are. The range for the day is 34 pips. The 22 day average is 71 pips (about a month of trading). I am not looking for any miracles today, but technically, the pair is trading between some technical levels which are worth monitoring for the rest of the trading week.
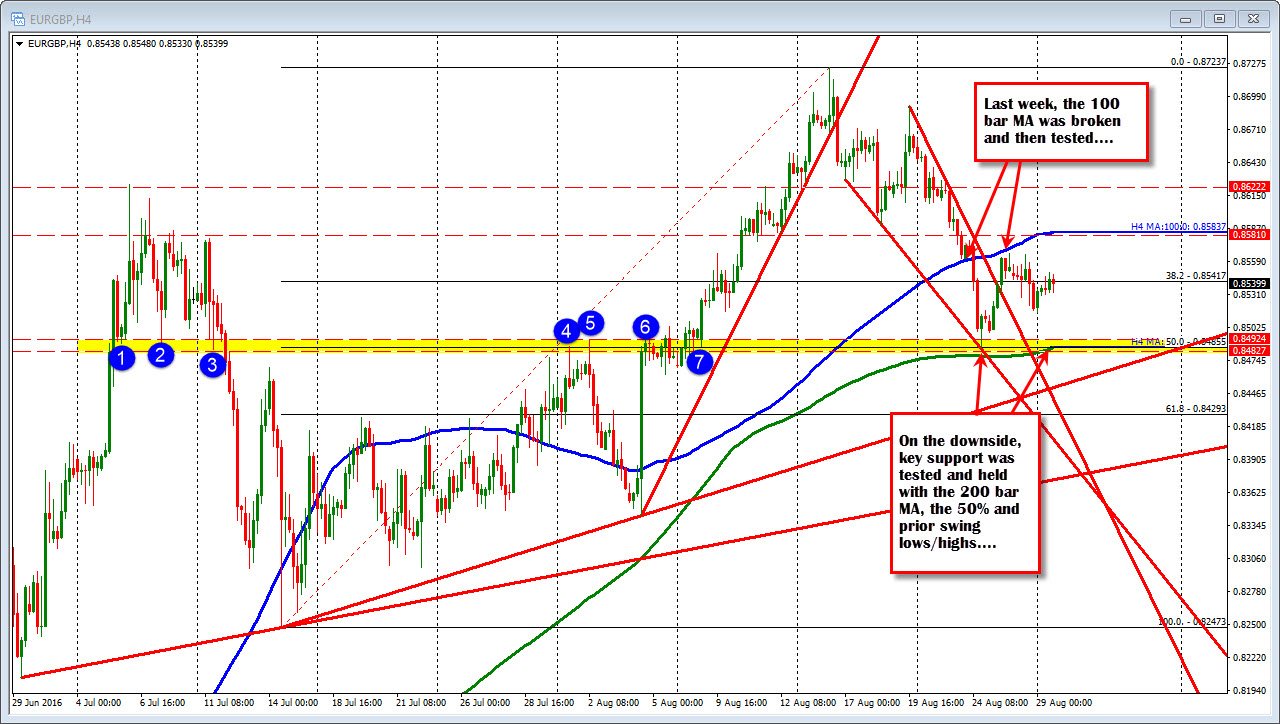
Looking at the 4 hour chart above, most of the activity in the early part of last week was to the downside. The EURUSD was hit hard. The GBPUSD went lower too, but it was more contained.
The move to the downside was fairly one way, UNTIL hitting a key support level at the end of the day on Wednesday. That support came in against the 200 bar MA, the 50% retracement, a lower channel trend line and some prior swing lows and highs (see yellow area in the chart above). The correction was on. That move higher stalled near the 100 bar MA on the same chart (blue line) on Thursday. End of rally. Friday was spent moving more to the downside in the pair.
The past technical story is important as it lays the pipe for the action this week. The support at 0.8482-92 has been tested and there are multiple reasons for traders to lean.
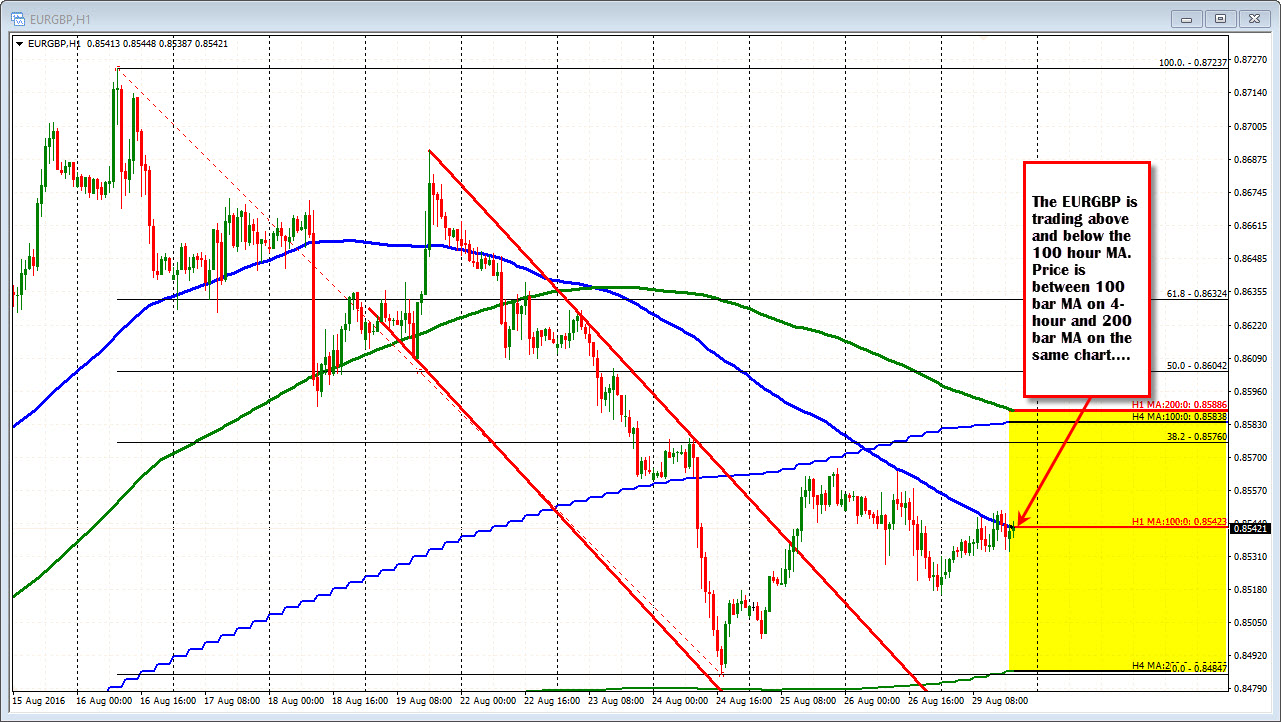
On the upside, the resistance at the 100 bar MA at 0.85837 is also key.
The price is now between the blue line above green line below. The price is also near the 38.2% retracement at 0.85417.
Drilling down into the hourly chart, the 100 hour MA has been tested over the last 8 or so hours. Typically, there is a movement away from the MA but with today a holiday, we may just go sideways. Nevertheless going forward, that 100 hour MA will act as a bullish and bearish rudder for the pair. On Friday the pair stayed below - keeping sellers more in control.