
Trend lines stall the climb. Now what?
The EURGBP tested a couple of trend lines on the 4-hour chart and daily charts, and that combination has stalled the rally in the pair. The GBPUSD is seeing more buying. The EURUSD has come off highs reached earlier in the London morning session.
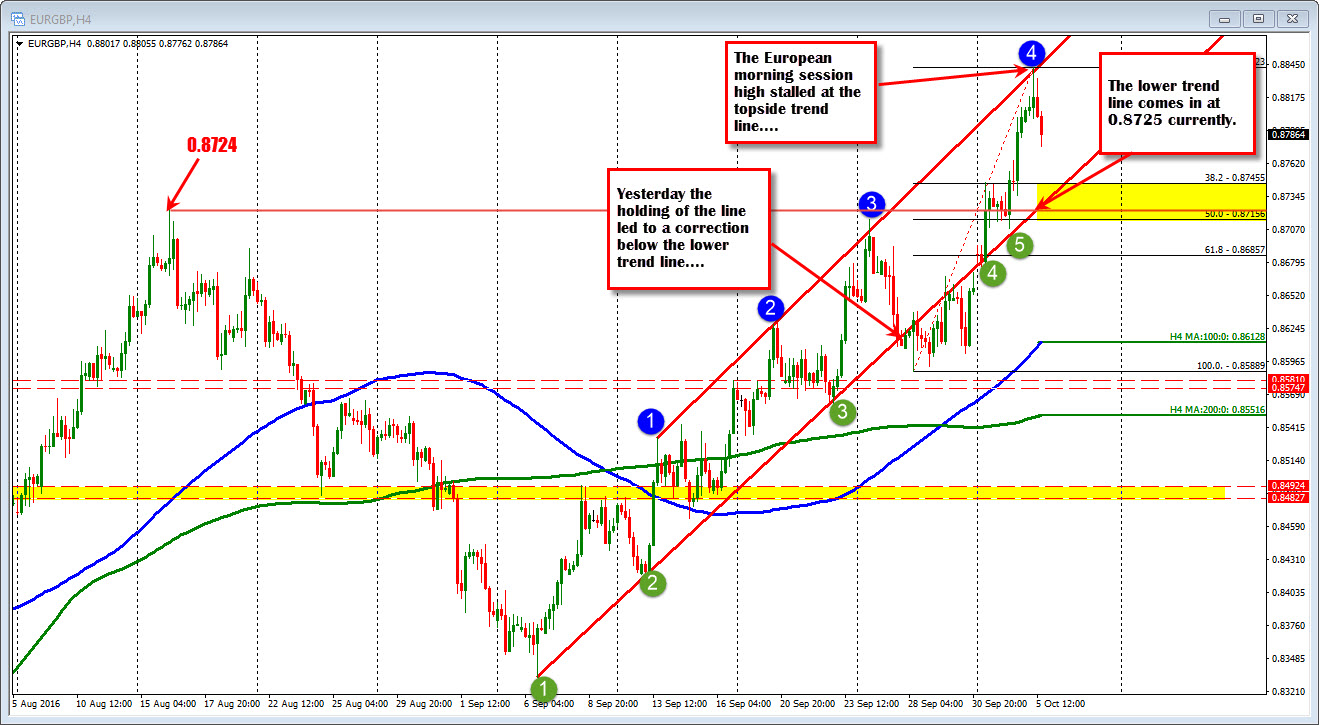
Looking at the 4 hour chart, the high trend line corresponds with a topside channel trend line. Yesterday that tend line was breached by a few pips, and reversed lower (even falling below the lower trend line). The upside was restarted just above support at the 0.8574-81 area, and in today's trading the lower trend line once again provided support (see green circle 4 and 5 in the chart above).
The rally to the highs on the chart, retested the topside channel trendline (at blue circle 4) in the early hours of the European session. Since then we are seeing a reversal back lower.
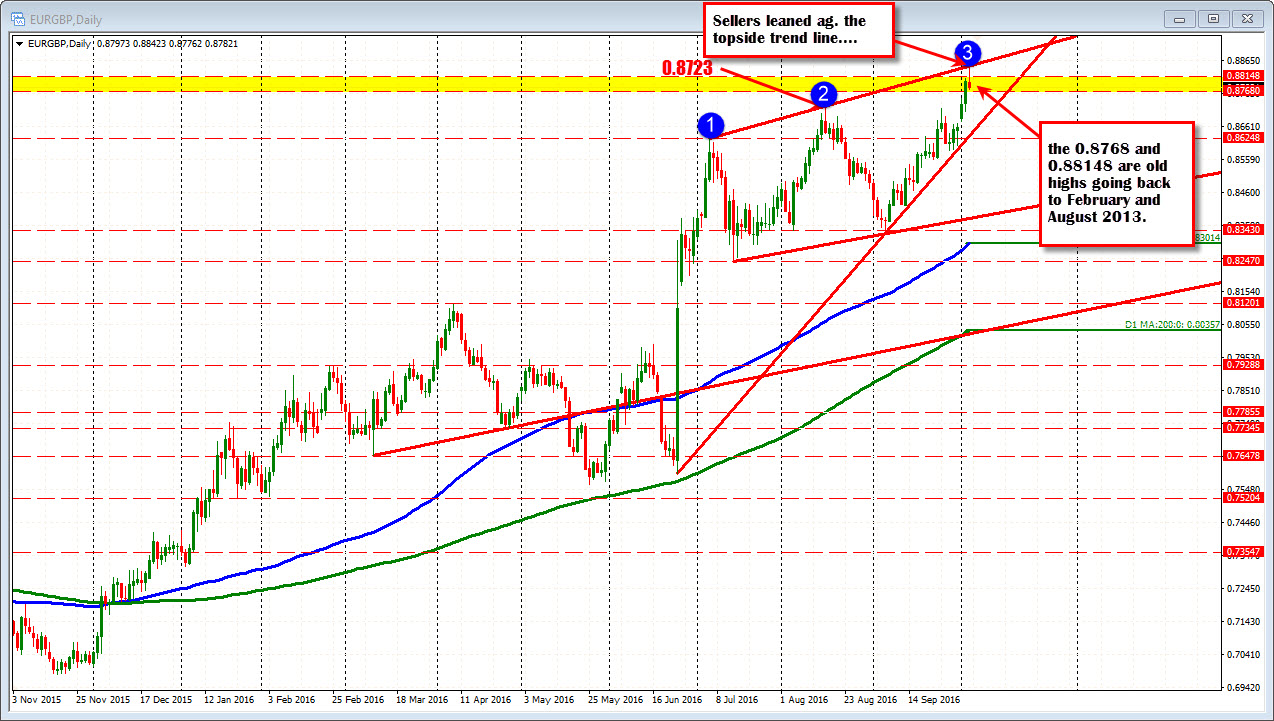
Meanwhile on the daily chart, a trend line connecting highs from July and August, cut across at 0.8845. The high price and trading today stalled at 0.88423.
So the combination of resistance from the 4-hour channel and the daily chart was enough to attract sellers.
What now?
Sellers above give the the rally cause for pause. Does it ruin the bullish run Not necessarily. It just muddy's the water.
On the 4-hour chart, the 0.8715-45 is the 38.2-50% retracement of the last move higher (from last weeks low). The swing high price from August 16 comes in at 0.8724. That level also corresponds with the trend line (green circles). That would be a target area for support buyers to lean against. If it holds the bulls remain in control.
On the daily chart, if you were to go back to 2013 (the last time the price in the EURGBP traded this high), the 0.8768 and 0.88148 levels were swing highs in February and August. We are below the 0.88148 level, but remain above the 0.8768 level (the corrective low just reached 0.8776). That level at 0.8768 will be an interim support level for this pair. Stay above it on this correction, and the sellers may have showed up against the trend lines above, but they are not showing me much selling follow thru. Eye that level. It is important on this correction lower.

