Trades at lowest level since March 20.
The AUDUSD is moving to new day lows and trades at the lowest level since March 20, 2015.
Helping contribute to the decline is Iron ore prices are trading at the lowest level since 2009. There is also increasing expectations that the Reserve Bank of Australia will need to ease sooner rather than later.
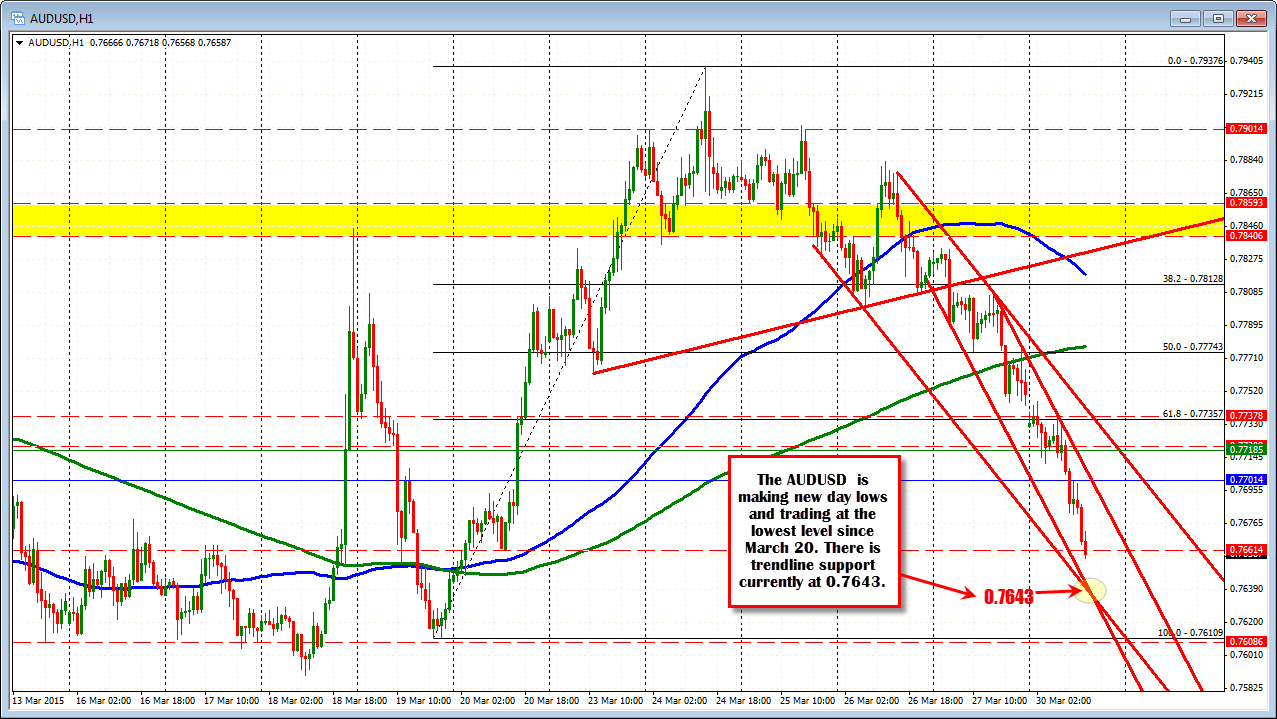
Looking at the hourly chart below, the price is getting closer to a convergence of trend lines at the 0.7643 level. This is the next target for the pair on the downside and should give traders a cause for pause.
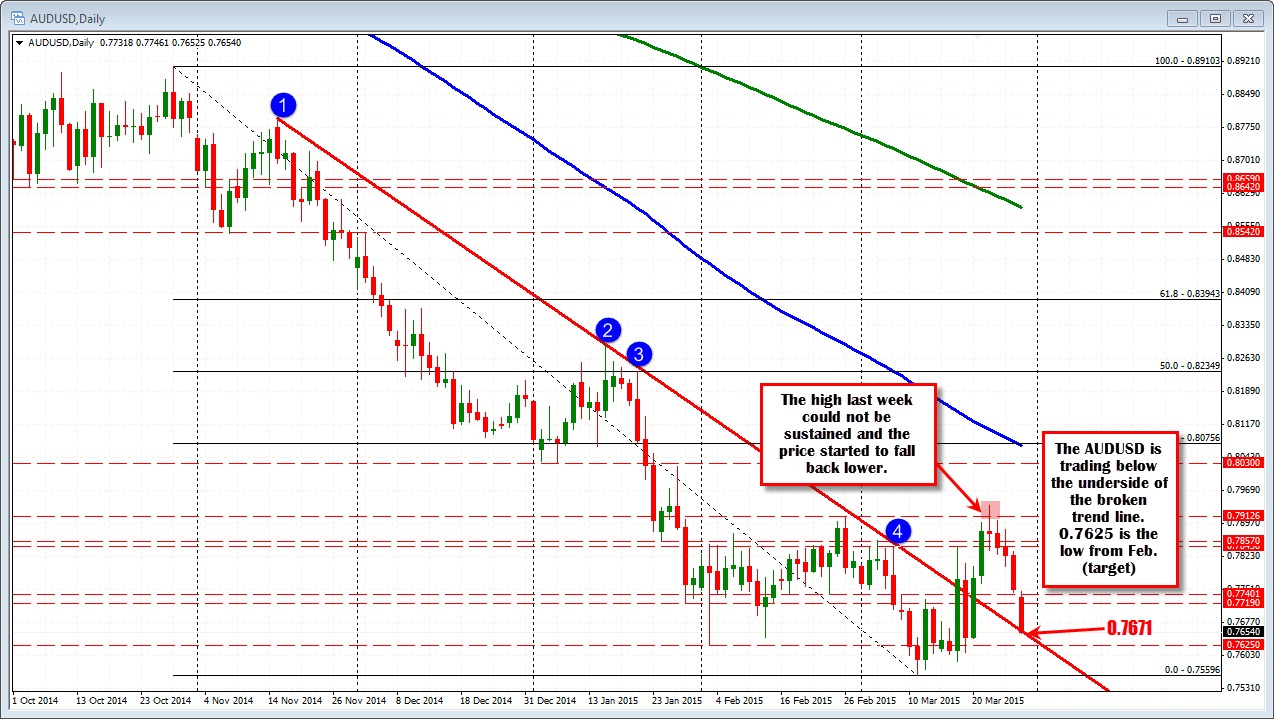
On the daily chart below, the market is moving below the underside of the trend line at the 0.7671 level. The fall below that level keeps the bears in control. It will be eyed as close resistance now, The 0.7625 is the low from the month of February. It will be the next downside target should the aforementioned 0.7643 level be broken. The low price in March came in at 0.75596 level and will be in traders sites if bearish momentum can continue in the near term.
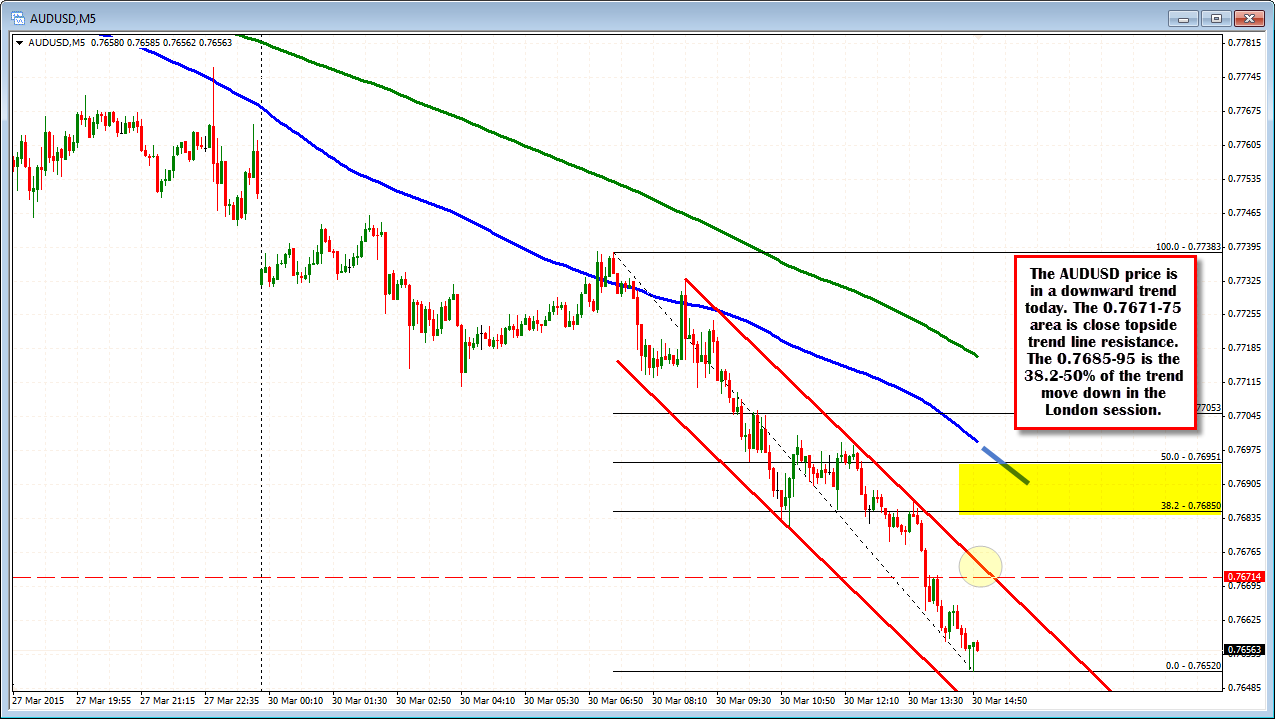
Looking at the 5 minute chart below, the pair is in a downward channel. The topside trend line comes in around the 0.7675 area. The 0.7671 is the trend line resistance level off the daily chart. This is solidifies that area as close resistance for the pair.
Above that area, the 38.2%-50% of the trend move lower comes in at 0.7685-95. This correction zone should cap the upside should there be a corrective move higher. The downward sloping 100 bar MA is approaching that area (blue line in the chart below), and should also help to keep a lid on the pair today.