
Trending to non trending, but trying to find a higher base today (100 hour MA)
The GBPUSD fell without hesitation from December 28 to January 19. Over that time period, the pair was down 14 days, up 2. The bears were rockin.
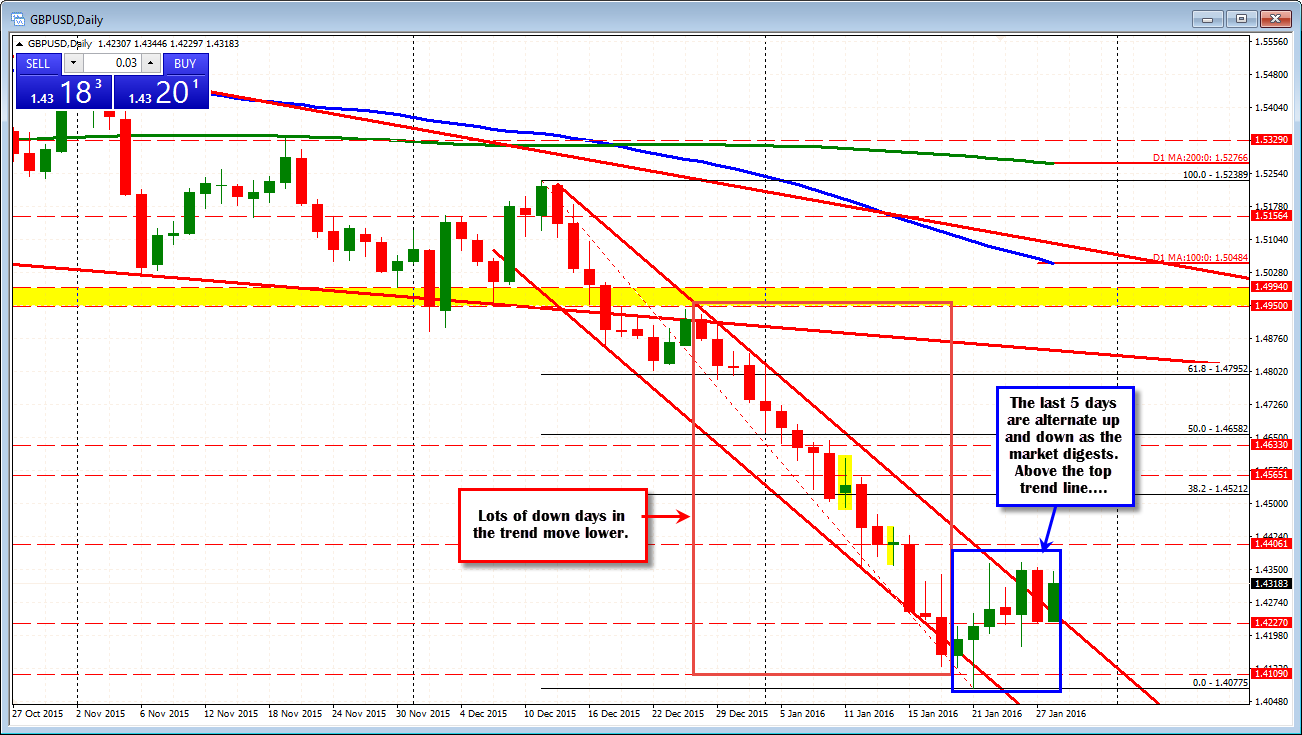
The last 7 trading days have have seen a bit of a slump with the ups winning 5 and the downs only 2. The last 5 have seen alternating fortunes. Up on Friday, down on Monday, up on Tuesday, down on Wednesday and up today (at least so far). The move lower since December 11 saw the price move about 1160 pips. The correction higher is only 290 pips or so (from low to the high on Tuesday at 1.4372). Hey... the sellers took a lot. The buyers so far a little but there is some progress from the carnage.
Drilling down to the hourly chart, what is it saying?
What I like about the up and down action especially yesterday and today, is the fall after the FOMC saw the GBPUSD fall to trend line support and hold. The 100 and 200 hour MAs (blue and green lines) were broken but most hourly bars at the lows, closed above the 200 hour MA. The Asia-Pacific session so market trade above and below the 200 hour moving average. Toward the end of the session, there was a move/break higher. The UK GDP helped a bit but then the price corrected. What I like about the correction is the 100 hour MA (blue line) just provided support.
What is not so great, is the high today stalled ahead of the next target at hte 1.4351-62 area.
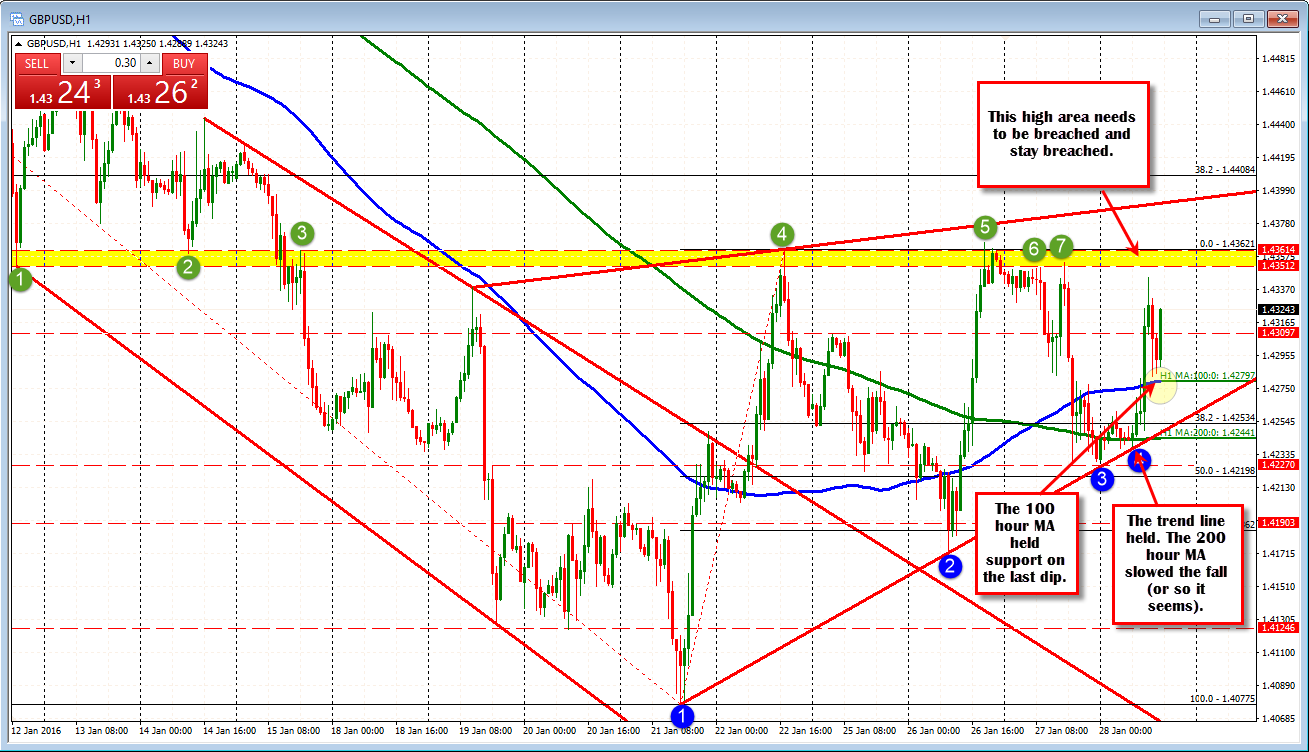
It is an up day for the pair. The pair fell short of the next target above but held support below (the 100 hour MA is a risk defining level for buyers). Stay above the 100 hour MA and traders know the hurdle above that needs to be broken. Durable goods were pretty darn weak.

