
The technical picture AFTER the storm
Forget about the sharp fall and sharp rebound. What has happened AFTER category 5 GBPUSD storm today started to subside. To do that I will focus on the 5 minute chart below.
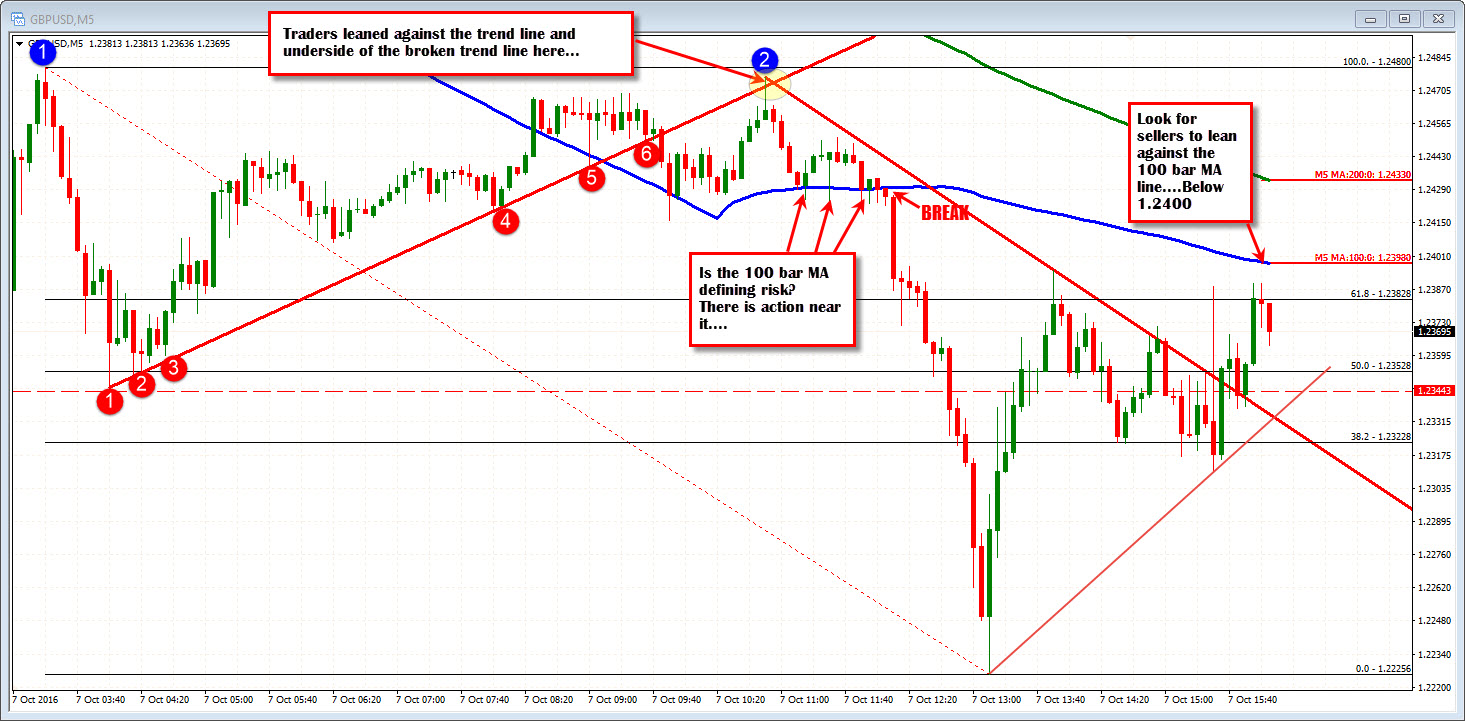
Looking at that chart, from the corrective high at 1.2480, to the low at 1.22256, there are a few technical things that stick out.
- The high at 1.2480 attracted sellers (see blue circle 2). That level also corresponded with the underside of the trend line (see red circles). The 1.2480 level is a tested technical level.
- The 100 bar MA on the 5- minute chart (blue line) seems to be a tool traders are using to define risk (and bullish/ bearish - see arrows). As the price came off the high, there was some buying near the MA line (blue line). Then there was a break and the buying reversed, sending the price down to the post-crash low at 1.22256. The price correction is staying below that line which currently comes in at 1.2398. The high price has reached 1.23897. If I were lean against a topside tool, that would be a risk defining level.
- The 50% of the move down comes in at 1.23528. The price action has been above and below that level as the market awaited the NFP report. Since the report, I can not say that there is any reaction to the level, but let's say, I put faith in the midpoint of moves. This is the midpoint area that may influence buyers/sellers. Se are trading around that level as I type (the chart above is a little outdated. We trade at 1.2358).
That is my look technically in what has been a very volatile day.
If you are to trade this pair, it seems the market is bit more normal now but risks are still elevated. Nevertheless, there may be some levels to give a bias. Right now, trading below the 100 bar MA at the 1.2398 is more bearish. But a move below the 50% level will be eyed for potential further bearishness.

