
100 day MA at 1.1445 (low for the day). 200 hour MA being tested at 1.1236
The EURUSD is testing the 200 hour MA (green line on the chart below) now after failing to take out the 100 day MA earlier at the 1.11456 level (the low reached 1.11457). The 200 hour MA is at 1.12368. The high has just extended to 1.1242. The range for the day is up to 96 pips now (22 day average is 111 pips). So that is more respectable vs what we were looking at when the NY day started. The 38.2% of the move down from the September high comes in at 1.1240. We are testing that level too.
The weaker US data and a lower stock market (?) is contributing to the dollars weakness. S&P have move below the 1900 level and the Nasdaq is down 2.01%.
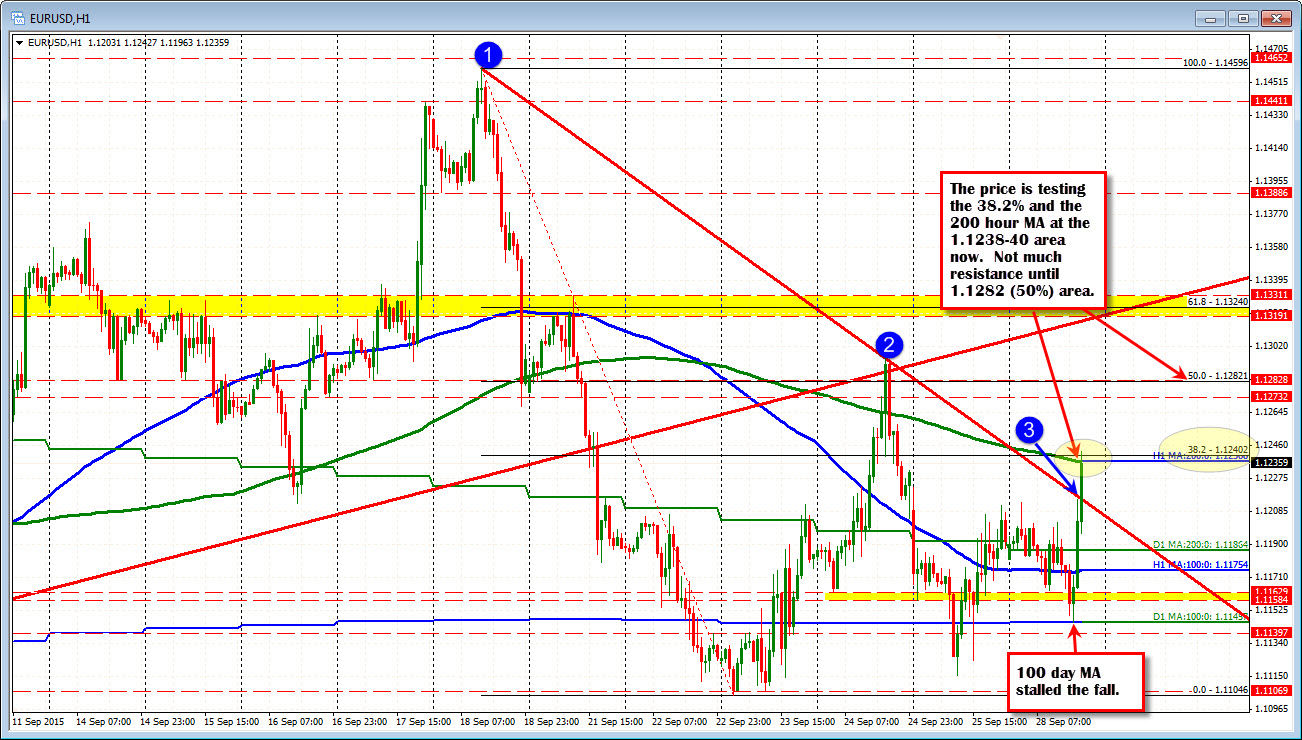
A move above the 1.1240, and there is not a lot of resistance until the price reaches the 1.1282 level where the 50% of the move down from the September high is found. Right now the price is taking a breather at the 200 hour MA and 38.2% retracement. We know that the market traders are quick to disappointment if there is not a break and run. SO be on the lookout. The broken trend line (see blue circle 3 in the chart above) comes in at the 1.1216 level. This would be support on a dip now.

