
USDJPY shows why we watch the big levels
116.00 has been a big level for months and I've harped on about it enough times for it to become boring. The PA over the last 24 hours shows why I have.
A lot of people had pencilled in the 115.50/60 level as the big one but I disagreed. 116.00 figure was the make or break number.
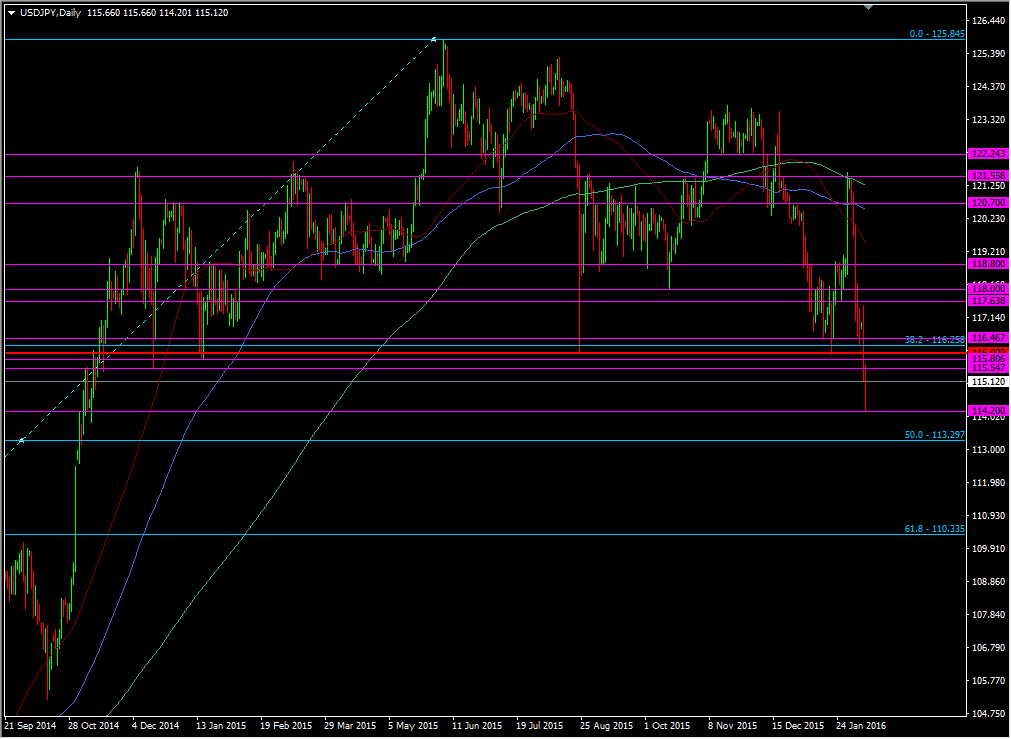
The chart above is almost technical perfection. It shows a level that is tested over a good amount of time, and then breaks with strong momentum.
Why did I see it as a big level?
When a level holds repeatedly the market gains confidence in it. That confidence translates into increased willingness to trade it. In this case that's good for buyers but the flip side is that the bigger the wall that gets built there, the bigger the damage will be when it's knocked down.
So 116 was the where the big wall was, not at 115.50/60. That's doesn't mean we should dismiss the level but the damage from this wall falling meant the risk was that it wouldn't stand up to much. As we know, yesterday it held up for a bit then crumbled. Then it became resistance for a while then broke. 115.80 was a level that had also held previous dips under 116.00 (as had 115.50/60). Even so the key was still 116 because despite those dips, we got back above that price and couldn't manage a close and hold below.
What's happened since? 115.85 was the retrace high yesterday and that's effectively been the confirmation of the break through 116.00, and then we dropped to 114.21, bounced to 115.50 and dropped again to 114.27 not long ago, and bounced and held 115.50 (there's that number again). That's all come from the 116 break.
The big questions is where do we go now?
The first target we can look to is the 50.0 fib of the Feb 2014 swing up. That's on the chart above at 113.30. While that's something definitive to look at we also need to take the whole move into consideration. We've fallen over 300 pips from Monday's Asia highs to last night's Asia lows. That's a big move and one we need to let develop. So far that development has shown the 114.20/25 to be where the current big support is sitting.
Why 114.20?
It played a part in the move up in Nov 2014 and became another level the price couldn't get back below. Swing out to the weekly chart and you can see it's (114.20/114.00) played a historical role too. The double tap today again tells you all you need to know. That could become the new 116.00, only time will tell.
All said and done we have a range to play with confidence. 116.00 on the upside, 114.20/00 on the downside (and now 115.50 in the middle). If 114.00/20 is to develop as a strong level then I would expect to see 114.50 to start showing as protection. That will be where the buyers will step in to try and keep the price from squeezing their longs. Should they win, up we go and the shorts might start having second thoughts about further downside. Break, and the shorts roll up their sleeves for another push.
Patience is always key in trading. We've had to wait for the 116 level to develop over a year. We've had to wait for it to develop since the August China blow out. Each time it showed us what it meant and gave us a tangible level to trade. That's what TA is all about and that's what patience is all about. Master it properly and you make good money, and more importantly, don't lose good money.

