
What are the key technicals in play
EURUSD
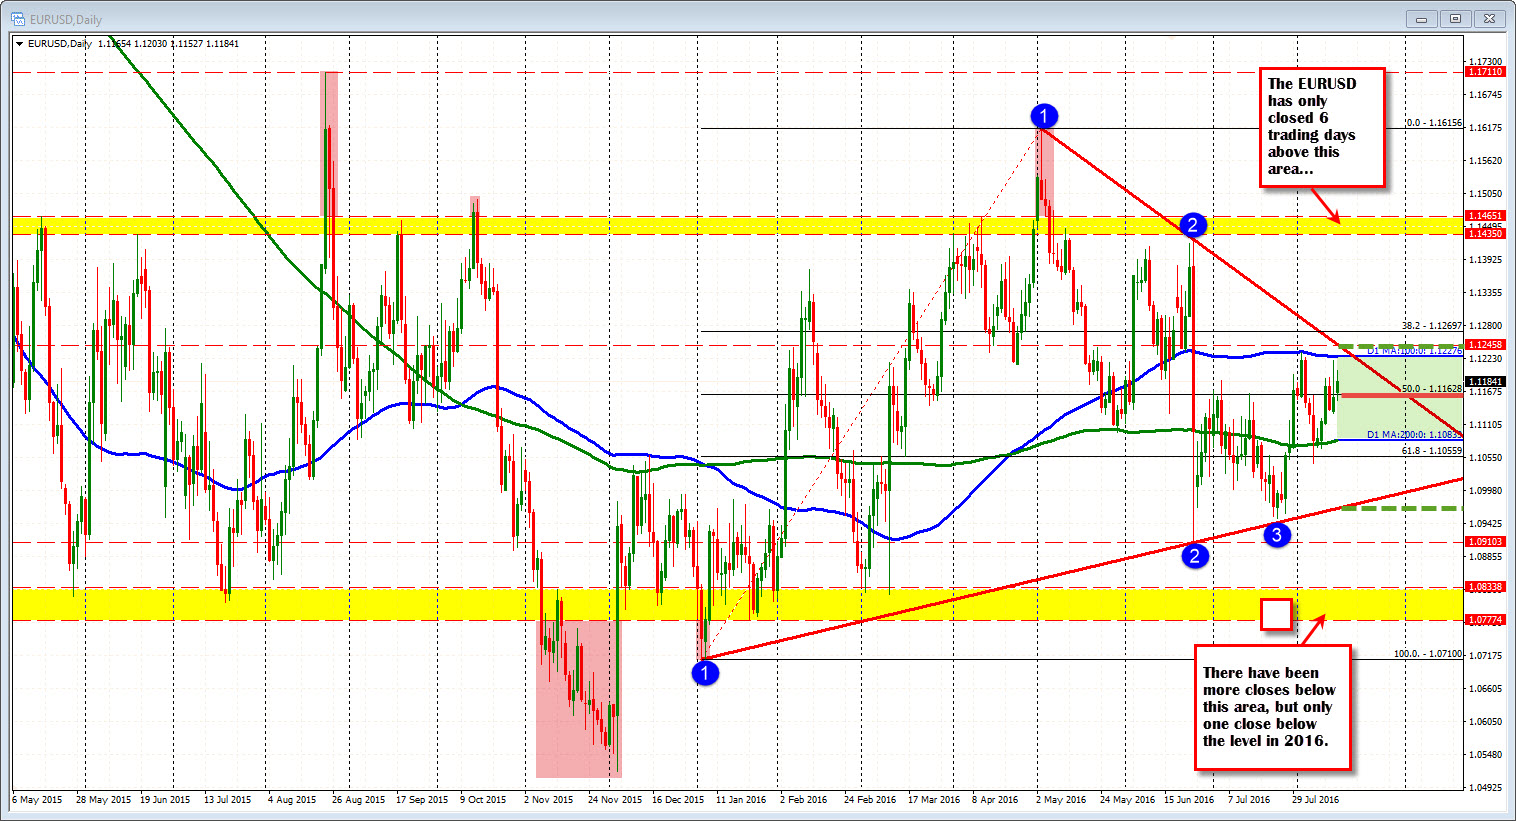
- Since July 29th, the EURUSD the price of the EURUSD has not traded closed a day above the 100 day MA (currently at 1.1227) or below the 200 day MA at 1.10833.
- Going back to May 2015, there have been only 6 days where the price closed above the 1.1465 level. The high in June only reached 1.1426.
- Going back to May 2015, there have been 19 days where the price closed below 1.1077 level. The low in June 2016 only got to
- There is a topside trend line at the 1.1246 level (Upper green dashed line)
- There is a lower trend line at 1.0967. (Lower green dashed line)
- The midpoint of the range since the August 2015 high is 1.1115
- The midpoint of 2016 is 1.11628
With the pairs price trading below the 100 day MA but above the 200 day MA, the bias is more neutral. The price is currently trading above the 50% of the years trading range (more bullish) but only by about 15 pips. At the lows of the day, the price was just below the level. Traders remain unsure of the directional bias during the summer months with the range converging. It might not be until September that we get a break and run. Even so, with support below and resistance above a move lower from 1.1160 might get down to 1.08000 (lower yellow area), while a move above may get to 1.1450 and stall (upside yellow area). Watch 1.11628 just for fun. If it holds...maybe...Just maybe, the buyers will take more control

